
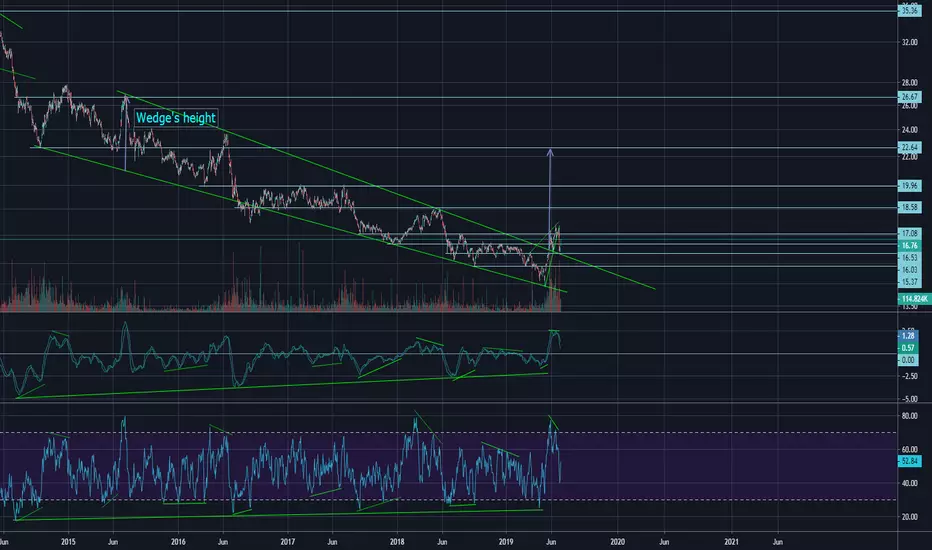
CORN has broken out of a bullish descending wedge pattern to the upside, entered a bearish rising wedge, broken down and back-tested the previous resistance level before bouncing back. There are positive divergences on the charts which suggest a much longer up trend in play. These positive divergences can also be seen on the weekly and monthly charts of CORN which also firm up the thesis of a new long term uptrend. When measuring the height of the wedge pattern and adding it to the breakout point, the anticipated price coincides with a former support/resistance level.

Отказ от ответственности
Информация и публикации не предназначены для предоставления и не являются финансовыми, инвестиционными, торговыми или другими видами советов или рекомендаций, предоставленных или одобренных TradingView. Подробнее читайте в Условиях использования.
Отказ от ответственности
Информация и публикации не предназначены для предоставления и не являются финансовыми, инвестиционными, торговыми или другими видами советов или рекомендаций, предоставленных или одобренных TradingView. Подробнее читайте в Условиях использования.