
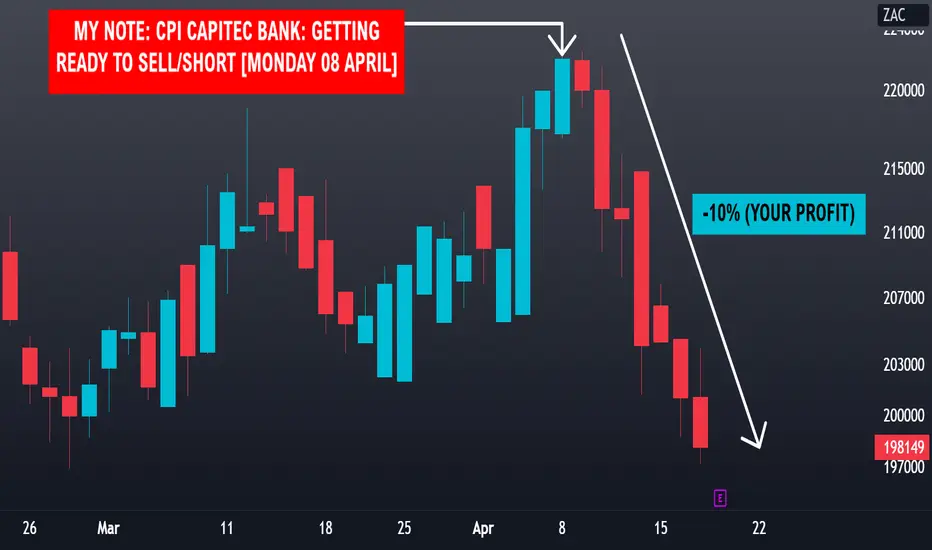
The chart below highlights the performance of Capitec Bank, which has declined by over 10% since last week's research note where clients were to a pending sell/short.
Included in my note was the following:
1. Weekly Chart highlighting the potential price path.
2. The TTG as of Friday's close.
3. The 7-day Technical Trend Rating shows the share as trading in overbought territory.
4. The 7-Week Technical Trend Rating shows the share as trading in 'high bullish momentum/approaching overbought' territory.
5. A common valuation metric for banks is Price-to-book. As of Friday's close, Capitec trades at 6.48x vs substantially lower levels for it's peer group.
Included in my note was the following:
1. Weekly Chart highlighting the potential price path.
2. The TTG as of Friday's close.
3. The 7-day Technical Trend Rating shows the share as trading in overbought territory.
4. The 7-Week Technical Trend Rating shows the share as trading in 'high bullish momentum/approaching overbought' territory.
5. A common valuation metric for banks is Price-to-book. As of Friday's close, Capitec trades at 6.48x vs substantially lower levels for it's peer group.

Отказ от ответственности
Информация и публикации не предназначены для предоставления и не являются финансовыми, инвестиционными, торговыми или другими видами советов или рекомендаций, предоставленных или одобренных TradingView. Подробнее читайте в Условиях использования.
Отказ от ответственности
Информация и публикации не предназначены для предоставления и не являются финансовыми, инвестиционными, торговыми или другими видами советов или рекомендаций, предоставленных или одобренных TradingView. Подробнее читайте в Условиях использования.