
CTD 4H - Coteccons Construction JSC | Bounce From Support, Headi
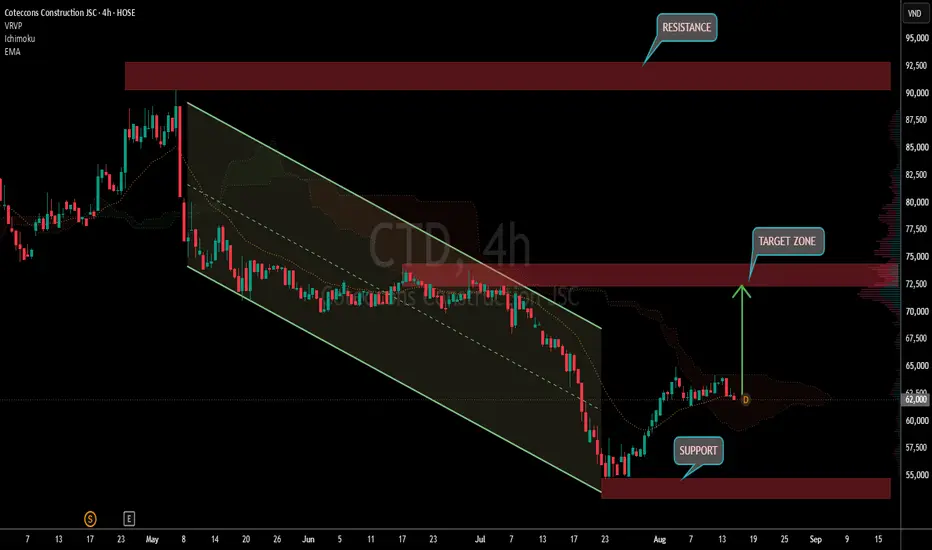
This is the Coteccons Construction JSC - CTD 4-Hour chart on HOSE from TradingView.
Chart Analysis:
1. Downtrend Channel: Price was in a clear falling channel for weeks. Multiple rejections from the top of the channel.
2. Support Bounce: Recently price dropped to the SUPPORT zone marked in pink around ∼55,000. Got a strong bullish reaction from there.
3. Recovery: Since the bounce, CTD has been climbing up. It’s now trading above the channel and testing mid-range levels.
4. Next Move: Chart shows an arrow pointing to the TARGET ZONE in red around ∼72,500 - 73,000. That was previous resistance.
Key Levels to Watch:
- Support: ∼55,000 - 56,000 - Pink zone. Must hold to keep bullish momentum
- Resistance / Target Zone: ∼72,500 - 73,000 - Red zone. Breakout here could open move toward ∼81,000 "RESISTANCE"
- Immediate: Watch for pullback to support or consolidation before next push up
Bias: Bullish while above support. If price breaks and holds above the 72,500 TARGET ZONE, trend shifts back to bullish. Rejection there = pullback likely.
Educational only. Not financial advice.
Сделка активна
active
t.me/+iZwBzq15KTM1Mzc0
join telegram for free signal on gold and different markets
t.me/+iZwBzq15KTM1Mzc0
join free telegram channel
join telegram for free signal on gold and different markets
t.me/+iZwBzq15KTM1Mzc0
join free telegram channel
Похожие публикации
Отказ от ответственности
Информация и публикации не предназначены для предоставления и не являются финансовыми, инвестиционными, торговыми или другими видами советов или рекомендаций, предоставленных или одобренных TradingView. Подробнее читайте в Условиях использования.
t.me/+iZwBzq15KTM1Mzc0
join telegram for free signal on gold and different markets
t.me/+iZwBzq15KTM1Mzc0
join free telegram channel
join telegram for free signal on gold and different markets
t.me/+iZwBzq15KTM1Mzc0
join free telegram channel
Похожие публикации
Отказ от ответственности
Информация и публикации не предназначены для предоставления и не являются финансовыми, инвестиционными, торговыми или другими видами советов или рекомендаций, предоставленных или одобренных TradingView. Подробнее читайте в Условиях использования.