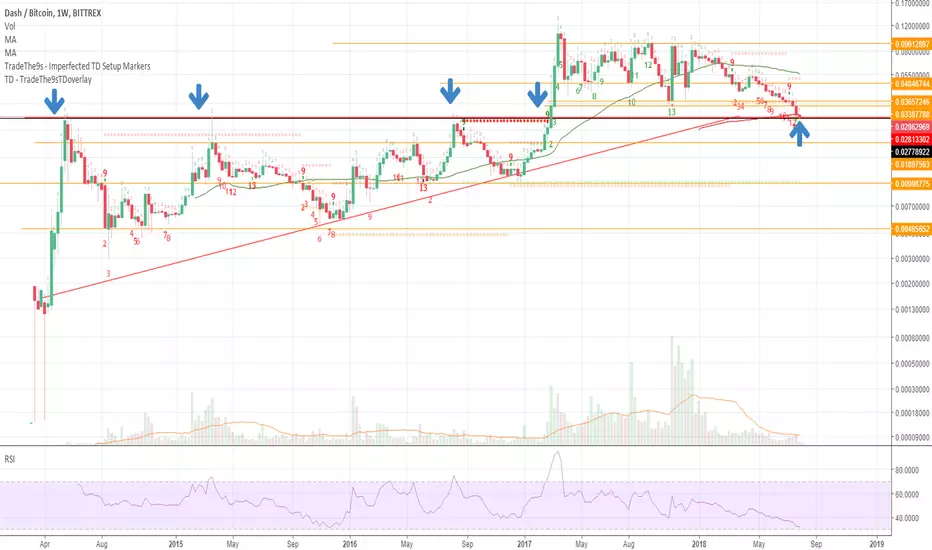
DDASHBTC testing a critical level on the weekly chart this week.
As you can see from the arrows, this level (black line) was tested multiple times before DASH had its massive breakout in 2017.
Zooming in on the 12H time frame below...you can see how the 12H came down to this line on a Perfected Buy Set Up and then flipped before completing the Set Up (Bullish).
Now trending back towards this level. Should it hold, will consider substantial long position.

Отказ от ответственности
Информация и публикации не предназначены для предоставления и не являются финансовыми, инвестиционными, торговыми или другими видами советов или рекомендаций, предоставленных или одобренных TradingView. Подробнее читайте в Условиях использования.
Отказ от ответственности
Информация и публикации не предназначены для предоставления и не являются финансовыми, инвестиционными, торговыми или другими видами советов или рекомендаций, предоставленных или одобренных TradingView. Подробнее читайте в Условиях использования.