
Executive Summary:
Dollar General runs one of the most extensive retail footprints in the United States, serving value‑oriented shoppers through more than twenty thousand small‑box stores concentrated in rural and underserved communities. Historically the model has generated attractive incremental returns. Stores are inexpensive to build, inventory turns quickly, and demand for everyday essentials tends to be steady.
Today, however, the company is working through a period of margin pressure, heavier capital investment, and growing operational complexity. Those issues have led investors to question whether the long‑running compounding story is still intact.
The core debate is straightforward. Either Dollar General remains a durable proximity‑driven retailer experiencing temporary execution issues, or the model is beginning to weaken structurally under cost pressures and store saturation.
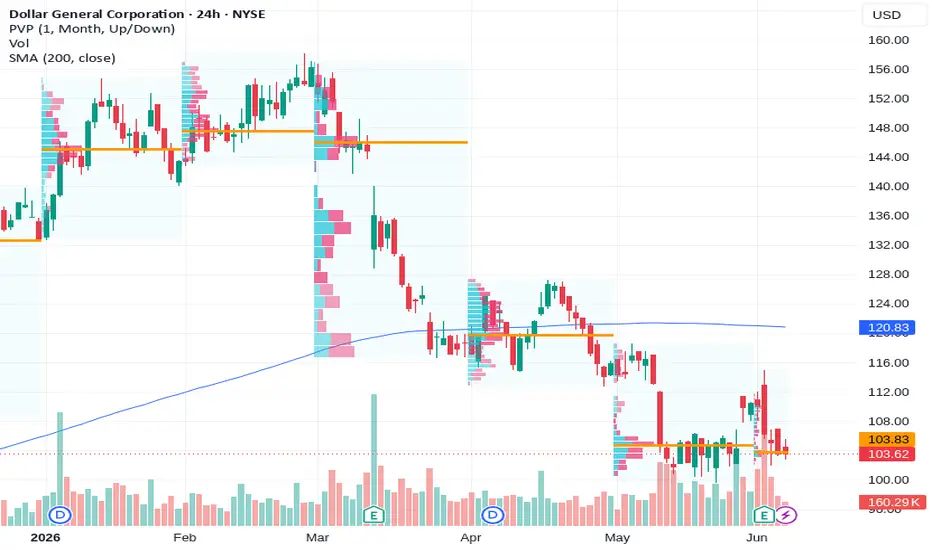
Margin of safety verdict up front: Trading approximately 56.8% below probability weighted fair value ($255.75), meeting a strict deep value margin of safety hurdle.
One Stock, Dozens of Voices:
This is not a single analyst’s view. CrowdWisdom reviewed 57 independent sources covering DG (11 professional trader videos (YouTube); 39 financial research articles (web); 1 live market intelligence feeds; 5 prior CrowdWisdom analysis snapshots (internal archive); 1 verified financial data checks (Yahoo Finance)) and synthesized the common threads. The goal was simple: identify where traders, investors, and researchers broadly agree, where opinions diverge, and what the market may be overlooking.
The analysis then stress‑tested those viewpoints by weighing a bull case against a skeptical bear case and examining what expectations appear embedded in the current price. All financial metrics were cross‑checked against live market data.
What follows highlights where the consensus forms, where it breaks down, and whether the current valuation offers a meaningful margin of safety.
Business Quality and Moat Durability:
Dollar General’s competitive advantage is unusual. It does not rely on intellectual property, cutting‑edge technology, or customer switching costs. The moat is largely geographic and built around convenience.
The company operates more than 20,900 stores across the United States. A large share of those locations sit in small towns or rural markets where large‑format retailers struggle to justify operating superstores. Because Dollar General stores are compact and relatively inexpensive to build, the company can profitably serve markets that are too small for Walmart Supercenters or warehouse clubs.
This dense footprint creates a proximity advantage. Many shopping trips involve small baskets: snacks, cleaning supplies, or personal care items. In those situations, convenience often matters more than squeezing out the lowest possible price.
Driving thirty minutes to a big box store to save a dollar on a ten dollar purchase rarely makes sense for the consumer. Ordering those same items online often fails the economics test as well, given delivery costs relative to the size of the basket.
The result is a convenience model built around habit and frequent visits.
Scale reinforces the model. A network of more than twenty thousand stores gives Dollar General purchasing leverage with suppliers and supports a national distribution system that smaller regional discount chains cannot easily match.
That said, the moat is not invulnerable.
Several forces could pressure the model. Walmart continues investing heavily in omnichannel retail and smaller neighborhood formats. Meanwhile e commerce companies continue improving last‑mile delivery speed.
Even so, delivering a five to ten dollar basket remains structurally difficult for online logistics networks. In many rural communities, a five minute drive to a nearby store is still the most efficient option.
Moat durability verdict: STABLE but fragile to operational execution. The physical network retains value, but margins depend heavily on disciplined store operations.
Return on Invested Capital (ROIC):
Historically Dollar General generated strong incremental returns on invested capital thanks to a highly capital‑efficient store model.
Typical store footprints range between seven thousand and nine thousand square feet. Construction costs are far lower than those required for large big‑box formats, and staffing needs are relatively modest.
That combination produced attractive payback periods on new locations.
For more than a decade the company used this model to expand aggressively while maintaining strong returns.
In recent years, however, the investment profile has shifted.
The company now expects capital expenditures of approximately $1.3 to $1.4 billion annually. These investments fund several initiatives.
First are large scale store remodel programs designed to improve store productivity and merchandising.
Second are supply chain investments including distribution infrastructure and the DG Fresh initiative, which seeks to improve fresh and frozen food logistics.
Third are digital investments including delivery partnerships and data driven merchandising initiatives.
Fourth are expansion projects including new stores and early international growth in markets such as Mexico.
These initiatives could ultimately strengthen the moat if they improve store execution and margins. At the same time they increase the capital intensity of the business.
If operating margins recover toward management’s long term target of roughly 6% to 7%, incremental returns may remain attractive. If margins stall while capital spending stays elevated, incremental ROIC could deteriorate.
Quality of Earnings:
In retail, earnings quality is best judged by comparing accounting profits with free cash flow.
The latest reported earnings quarter generated approximately $10.79 billion in revenue and roughly $2.16 billion in free cash flow. Over the trailing twelve months the company has produced approximately $1.88 billion of free cash flow.
Accounting earnings and cash generation appear broadly aligned.
That said, the composition of the cash flow deserves attention.
Annual capital expenditures near $1.3 to $1.4 billion consume a large portion of operating cash flow. If capital spending continues to grow faster than operating income, free cash flow growth could lag reported earnings growth.
In short, earnings quality today looks solid, but investors should watch capital intensity closely.
Capital Allocation Scorecard:
Dollar General’s capital allocation still reflects a retailer focused primarily on reinvesting in its store network.
Reinvestment in Stores
Management continues to fund new store construction and thousands of store remodels each year. Historically these projects generated strong returns. The open question is whether incremental returns remain as attractive as the store base approaches saturation.
Dividends
The company pays a quarterly dividend of $0.59 per share, equivalent to approximately $2.36 annually. At current prices this equates to a yield of roughly 2.2%. The payout remains modest relative to free cash flow, leaving room for reinvestment.
Share Buybacks
Buybacks have historically contributed to shareholder returns, although activity has slowed during periods of elevated capital spending.
Balance Sheet
Net debt to EBITDA sits around 1.6 times, a conservative level for a stable consumer defensive retailer.
Overall capital allocation grade: B. Management appears disciplined, though the investment case increasingly depends on operational improvement justifying higher capital spending.
Customer and Revenue Concentration:
Dollar General does not face traditional customer concentration risk. Revenue comes from millions of small transactions spread across a broad customer base.
However, the company does carry a different type of concentration risk at the macro level.
A significant portion of its shoppers come from lower income households. These consumers are particularly sensitive to inflation, fuel prices, and government assistance programs such as SNAP.
Shifts in those variables can affect spending patterns quickly.
For instance, reductions in government assistance or rising fuel costs can tighten household budgets. That can reduce basket sizes or shift purchases toward the lowest margin consumable goods.
So while the company is not dependent on any single customer, it is economically tied to one of the most financially constrained segments of the consumer population.
Management Alignment:
Insider ownership appears modest, which is common among mature public retailers.
Executive compensation emphasizes operational metrics such as same store sales growth, margin performance, and overall profitability.
These incentives align management with near‑term operational execution, though they may also encourage aggressive store expansion.
Investors should watch whether management prioritizes long term return on invested capital rather than simply maximizing unit growth.
10-Year Durability Test:
One useful investment test is asking whether the competitive landscape remains reasonably understandable over the next decade.
Dollar General’s business is easier to grasp than many technology companies. At its core, it is a straightforward retail operation selling essential goods to value‑oriented shoppers.
Still, several structural forces could pressure the business over ten years.
Technological improvements in logistics could eventually reduce delivery costs enough to weaken the convenience advantage of nearby stores.
Store saturation is another possibility. With more than twenty thousand locations, the company may eventually approach the limits of economically viable expansion in rural markets.
Municipal regulations could also limit growth in certain areas where communities argue that dollar stores discourage full grocery development.
Finally, the financial health of the low income consumer base remains uncertain. Persistent inflation or reductions in government assistance could affect demand.
Despite those risks, the underlying demand for low priced essentials is likely to remain durable. Rural communities will continue to need accessible retail outlets.
Overall, the business appears reasonably predictable over a decade, though margins may fluctuate meaningfully.
Multi-Year Thesis (3 to 7 years):
Bull Case Scenario:
Probability: 35%
Assumptions:
Operating margins recover toward approximately 7% as shrink declines and operational execution improves.
Same store sales grow roughly 3% annually as traffic increases and private label penetration rises.
Store remodel programs materially improve productivity and incremental returns remain strong.
Retail media and digital initiatives add higher margin revenue streams.
Estimated intrinsic value: $300
Base Case Scenario:
Probability: 45%
Assumptions:
Operating margins stabilize around roughly 6%.
Same store sales grow approximately 2% annually supported by steady traffic from value oriented consumers.
Store expansion continues but incremental returns gradually decline as the network matures.
Free cash flow grows in the mid single digits over time.
Estimated intrinsic value: $255
Bear Case Scenario:
Probability: 20%
Assumptions:
Operating margins compress toward roughly 4.5% to 5% due to labor inflation, shrink, and price competition.
Same store sales slow toward roughly 1% growth or lower due to consumer pressure and store saturation.
Incremental store productivity declines meaningfully.
Capital expenditures remain elevated just to maintain store standards.
Estimated intrinsic value: $180
Margin of Safety Verdict:
weighted_intrinsic_value: $255.75
current_price: $110.61
discount_to_weighted_iv: 56.8%
mos_bucket: deep_value
Trading ~56.8% below probability-weighted fair value ($255.75), meeting a strict deep-value margin-of-safety hurdle.
This valuation suggests the market is pricing in either prolonged margin weakness or structural deterioration in the business model. If margins simply stabilize and modest growth continues, today’s price could represent a meaningful undervaluation.
Peak Margin Stress Test:
Dollar General currently operates with gross margins around 30.8% and operating margins near 5.9%.
If operating margins declined to approximately 4.5%, EBIT could fall roughly 20%.
Under that scenario valuation multiples would expand significantly and intrinsic value could compress toward roughly $80 to $90 per share.
That implies potential downside of roughly 15% to 25% from current trading levels if profitability deteriorates materially.
Valuation Framing:
Several frameworks help frame the opportunity.
Free Cash Flow Yield
Trailing free cash flow of approximately $1.88 billion against a market capitalization near $23 billion implies a free cash flow yield near 8%.
Comparable Multiples
The stock trades around 15 times trailing earnings and approximately 11 times EBITDA, a relatively modest valuation for a consumer defensive retailer.
Discounted Cash Flow
Long term models assuming mid single digit free cash flow growth and stable margins produce fair value estimates in the $140 to $160 range under conservative assumptions.
The wide gap between conservative valuations and the probability weighted scenario highlights uncertainty around margin recovery.
Perception vs Reality:
Perception: Dollar General is a declining discount retailer facing structural competition from Walmart and online retail.
Reality: The store network remains dense, demand for low priced essentials remains stable, and many of the company’s operational challenges appear fixable.
Why This May Be Misunderstood:
Investors often underestimate the value of physical retail density.
Thousands of small stores embedded throughout rural communities represent a distribution advantage that cannot be replicated quickly.
At the same time, recent margin pressure may be causing investors to extrapolate short term issues too far into the future.
Three Measurable Things to Watch Next Quarter:
Same store sales growth relative to the long term 2% to 3% framework.
Operating margin progression toward the 6% range.
Free cash flow generation relative to planned capital expenditures.
Historical Conviction Drift:
A decade ago Dollar General was widely viewed as a high quality compounder, supported by consistent store expansion and strong unit economics.
More recently sentiment has cooled as margins compressed and operational issues became more visible.
The current valuation reflects that shift in perception.
Disconfirming Evidence:
The strongest argument against owning the stock is that the historical expansion model may be approaching its limits.
If rural markets are nearing saturation, new stores could increasingly cannibalize existing locations.
Combined with rising labor costs and greater operational complexity, that dynamic could permanently reduce incremental returns on invested capital.
In that scenario Dollar General would begin to resemble a low growth retailer with thin margins and heavy reinvestment requirements.
Risks:
Structural pressure on the low income consumer base.
Potential saturation of rural store markets.
Persistent shrink and theft issues.
Competition from Walmart and other discount retailers.
Improving e commerce logistics that could erode convenience advantages.
Municipal restrictions on new dollar store development.
Summary:
Dollar General remains a straightforward business built on a historically effective strategy: place small, low cost stores close to value oriented consumers and generate steady cash flow from frequent purchases of essential goods.
The investment debate today centers on whether current operational challenges are temporary disruptions or signs of permanent deterioration in the model.
At today’s prices the market appears to be leaning toward the latter.
If management restores operating margins and maintains modest growth, the current valuation could prove overly pessimistic.
If margins remain structurally pressured, what looks like a bargain may instead become a classic value trap.
For disciplined investors, the central question remains simple: does the rural proximity moat still work?
Data Snapshot:
Metric: Price
Metric: Value
Current Price (DG): $106.27
Market Capitalization: $23.44 billion
Shares Outstanding: 220,586,647
Trailing P/E: 15.03x
Forward P/E: 13.38x
Enterprise Value (EV): $37.89 billion
EV/EBITDA: 11.18x
Revenue (TTM): $43.08 billion
Gross Margin: 30.83%
Operating Margin: 5.92%
Free Cash Flow (FCF): $1.88 billion
FCF Yield: 8.03%
52-Week Range: $95.11 to $158.23
Sector: Consumer Defensive
Industry: Discount Stores
Data Freshness: post-earnings Yahoo lag
Reported Earnings Quarter Revenue (event): $10.79 billion
Yahoo Statements Quarter Revenue (prior, stale) (2026-01-31): $10.91 billion
Reported Earnings Quarter FCF (event): $2.16 billion
FCF TTM (may lag): $1.88 billion
Yahoo Statements Quarter Gross Margin: 30.45%
Latest Reported EPS: 2.0 (surprise 6.22%)
Next Quarter Revenue Guide (Yahoo calendar): $11.10 billion to $11.22 billion (avg $11.17 billion)
Analyst Consensus +1q Revenue (NOT company guide): $11.09 billion
Dividend (earnings event): $0.59/quarter
TTM Staleness Flag: TTM revenue/margins/FCF may lag 24-72h after earnings
References:
This analysis reviewed approximately 1126 article sources and 174 video transcripts.
1. Yahoo Finance. Dollar General Corporation (DG) Company Profile and Financial Data. finance.yahoo.com/quote/DG
2. Yahoo Finance. Dollar General Corporation (DG): A Bull Case Theory. finance.yahoo.com/news/dollar-general-corporation-dg-bull-002907823.html
3. Yahoo Finance. Dollar General Corporation (DG): A Bull Case Theory. finance.yahoo.com/news/dollar-general-corporation-dg-bull-163536355.html
4. Yahoo Finance. Dollar General Corporation (DG): A Bull Case Theory. finance.yahoo.com/news/dollar-general-corporation-dg-bull-173839564.html
5. Yahoo Finance. Did Store Remodels and Raised Guidance Just Shift Dollar General’s Investment Narrative. finance.yahoo.com/news/did-store-remodels-raised-guidance-155153997.html
6. GuruFocus. Dollar General Corp Q2 2025 Earnings Call Highlights: Strong Sales Growth and Digital Expansion. finance.yahoo.com/news/dollar-general-corp-dg-q2-070656424.html
7. GuruFocus. Dollar General Corp Q4 2025 Earnings Call Highlights: Strong Sales Growth and Profitability Surge. finance.yahoo.com/news/dollar-general-corp-dg-q4-190335345.html
8. GuruFocus. Dollar General Corp Q1 2026 Earnings Call Highlights: Strong Sales Growth Amid Economic Challenges. ca.finance.yahoo.com/news/dollar-general-corp-dg-q1-210038689.html
9. Simply Wall St. An Intrinsic Calculation For Dollar General Corporation Suggests It Is Undervalued. simplywall.st/stocks/us/consumer-retailing/nyse-dg/dollar-general/news/an-intrinsic-calculation-for-dollar-general-corporation-nyse
10. Macrotrends. Dollar General PE Ratio Historical Data. macrotrends.net/stocks/charts/DG/dollar-general/pe-ratio
11. StockAnalysis. Dollar General Revenue History. stockanalysis.com/stocks/dg/revenue
12. MarketBeat. Dollar General Analyst Price Targets and Forecasts. marketbeat.com/stocks/NYSE/DG/forecast
13. MarketScreener. Dollar General Analyst Consensus Estimates. marketscreener.com/quote/stock/DOLLAR-GENERAL-CORPORATIO-5699818/consensus
14. Public.com. Dollar General PE Ratio Insights. public.com/stocks/dg/pe-ratio
15. StockStory. Dollar General Research Report. stockstory.org/us/stocks/nyse/dg
16. ChartMill. Dollar General Earnings History and Surprise Analysis. chartmill.com/stock/quote/DG/earnings
17. KoalaGains. Dollar General Competitive Analysis. koalagains.com/stocks/NYSE/DG/competition
18. Kavout Market Lens. Why Is Dollar General Stock Sliding Despite Strong Q4 Results. kavout.com/market-lens/why-is-dollar-general-stock-sliding-despite-strong-q4-results
19. YouTube Channels Referenced:
20. EverythingMoney. Dollar General Stock Analysis. youtube.com/watch?v=7IU9YpoRpyg
21. Mark Meldrum. Retail Sector Analysis. youtube.com/watch?v=mH72Rc1Ijgw
22. SmartStockWatch. Dollar General Business Overview. youtube.com/watch?v=G_qgAzZwyeQ
23. Second Order. Dollar General Strategy Breakdown. youtube.com/watch?v=Hps9sp78c6g
24. Charged Alpha Stock Encyclopedia. Dollar General Corporate Overview. youtube.com/watch?v=1uIGTW6Gjx8
Disclaimer:
This analysis is for informational purposes only and does not constitute investment advice. Investors should conduct their own research and consider their financial circumstances before making investment decisions.
Dollar General runs one of the most extensive retail footprints in the United States, serving value‑oriented shoppers through more than twenty thousand small‑box stores concentrated in rural and underserved communities. Historically the model has generated attractive incremental returns. Stores are inexpensive to build, inventory turns quickly, and demand for everyday essentials tends to be steady.
Today, however, the company is working through a period of margin pressure, heavier capital investment, and growing operational complexity. Those issues have led investors to question whether the long‑running compounding story is still intact.
The core debate is straightforward. Either Dollar General remains a durable proximity‑driven retailer experiencing temporary execution issues, or the model is beginning to weaken structurally under cost pressures and store saturation.
Margin of safety verdict up front: Trading approximately 56.8% below probability weighted fair value ($255.75), meeting a strict deep value margin of safety hurdle.
One Stock, Dozens of Voices:
This is not a single analyst’s view. CrowdWisdom reviewed 57 independent sources covering DG (11 professional trader videos (YouTube); 39 financial research articles (web); 1 live market intelligence feeds; 5 prior CrowdWisdom analysis snapshots (internal archive); 1 verified financial data checks (Yahoo Finance)) and synthesized the common threads. The goal was simple: identify where traders, investors, and researchers broadly agree, where opinions diverge, and what the market may be overlooking.
The analysis then stress‑tested those viewpoints by weighing a bull case against a skeptical bear case and examining what expectations appear embedded in the current price. All financial metrics were cross‑checked against live market data.
What follows highlights where the consensus forms, where it breaks down, and whether the current valuation offers a meaningful margin of safety.
Business Quality and Moat Durability:
Dollar General’s competitive advantage is unusual. It does not rely on intellectual property, cutting‑edge technology, or customer switching costs. The moat is largely geographic and built around convenience.
The company operates more than 20,900 stores across the United States. A large share of those locations sit in small towns or rural markets where large‑format retailers struggle to justify operating superstores. Because Dollar General stores are compact and relatively inexpensive to build, the company can profitably serve markets that are too small for Walmart Supercenters or warehouse clubs.
This dense footprint creates a proximity advantage. Many shopping trips involve small baskets: snacks, cleaning supplies, or personal care items. In those situations, convenience often matters more than squeezing out the lowest possible price.
Driving thirty minutes to a big box store to save a dollar on a ten dollar purchase rarely makes sense for the consumer. Ordering those same items online often fails the economics test as well, given delivery costs relative to the size of the basket.
The result is a convenience model built around habit and frequent visits.
Scale reinforces the model. A network of more than twenty thousand stores gives Dollar General purchasing leverage with suppliers and supports a national distribution system that smaller regional discount chains cannot easily match.
That said, the moat is not invulnerable.
Several forces could pressure the model. Walmart continues investing heavily in omnichannel retail and smaller neighborhood formats. Meanwhile e commerce companies continue improving last‑mile delivery speed.
Even so, delivering a five to ten dollar basket remains structurally difficult for online logistics networks. In many rural communities, a five minute drive to a nearby store is still the most efficient option.
Moat durability verdict: STABLE but fragile to operational execution. The physical network retains value, but margins depend heavily on disciplined store operations.
Return on Invested Capital (ROIC):
Historically Dollar General generated strong incremental returns on invested capital thanks to a highly capital‑efficient store model.
Typical store footprints range between seven thousand and nine thousand square feet. Construction costs are far lower than those required for large big‑box formats, and staffing needs are relatively modest.
That combination produced attractive payback periods on new locations.
For more than a decade the company used this model to expand aggressively while maintaining strong returns.
In recent years, however, the investment profile has shifted.
The company now expects capital expenditures of approximately $1.3 to $1.4 billion annually. These investments fund several initiatives.
First are large scale store remodel programs designed to improve store productivity and merchandising.
Second are supply chain investments including distribution infrastructure and the DG Fresh initiative, which seeks to improve fresh and frozen food logistics.
Third are digital investments including delivery partnerships and data driven merchandising initiatives.
Fourth are expansion projects including new stores and early international growth in markets such as Mexico.
These initiatives could ultimately strengthen the moat if they improve store execution and margins. At the same time they increase the capital intensity of the business.
If operating margins recover toward management’s long term target of roughly 6% to 7%, incremental returns may remain attractive. If margins stall while capital spending stays elevated, incremental ROIC could deteriorate.
Quality of Earnings:
In retail, earnings quality is best judged by comparing accounting profits with free cash flow.
The latest reported earnings quarter generated approximately $10.79 billion in revenue and roughly $2.16 billion in free cash flow. Over the trailing twelve months the company has produced approximately $1.88 billion of free cash flow.
Accounting earnings and cash generation appear broadly aligned.
That said, the composition of the cash flow deserves attention.
Annual capital expenditures near $1.3 to $1.4 billion consume a large portion of operating cash flow. If capital spending continues to grow faster than operating income, free cash flow growth could lag reported earnings growth.
In short, earnings quality today looks solid, but investors should watch capital intensity closely.
Capital Allocation Scorecard:
Dollar General’s capital allocation still reflects a retailer focused primarily on reinvesting in its store network.
Reinvestment in Stores
Management continues to fund new store construction and thousands of store remodels each year. Historically these projects generated strong returns. The open question is whether incremental returns remain as attractive as the store base approaches saturation.
Dividends
The company pays a quarterly dividend of $0.59 per share, equivalent to approximately $2.36 annually. At current prices this equates to a yield of roughly 2.2%. The payout remains modest relative to free cash flow, leaving room for reinvestment.
Share Buybacks
Buybacks have historically contributed to shareholder returns, although activity has slowed during periods of elevated capital spending.
Balance Sheet
Net debt to EBITDA sits around 1.6 times, a conservative level for a stable consumer defensive retailer.
Overall capital allocation grade: B. Management appears disciplined, though the investment case increasingly depends on operational improvement justifying higher capital spending.
Customer and Revenue Concentration:
Dollar General does not face traditional customer concentration risk. Revenue comes from millions of small transactions spread across a broad customer base.
However, the company does carry a different type of concentration risk at the macro level.
A significant portion of its shoppers come from lower income households. These consumers are particularly sensitive to inflation, fuel prices, and government assistance programs such as SNAP.
Shifts in those variables can affect spending patterns quickly.
For instance, reductions in government assistance or rising fuel costs can tighten household budgets. That can reduce basket sizes or shift purchases toward the lowest margin consumable goods.
So while the company is not dependent on any single customer, it is economically tied to one of the most financially constrained segments of the consumer population.
Management Alignment:
Insider ownership appears modest, which is common among mature public retailers.
Executive compensation emphasizes operational metrics such as same store sales growth, margin performance, and overall profitability.
These incentives align management with near‑term operational execution, though they may also encourage aggressive store expansion.
Investors should watch whether management prioritizes long term return on invested capital rather than simply maximizing unit growth.
10-Year Durability Test:
One useful investment test is asking whether the competitive landscape remains reasonably understandable over the next decade.
Dollar General’s business is easier to grasp than many technology companies. At its core, it is a straightforward retail operation selling essential goods to value‑oriented shoppers.
Still, several structural forces could pressure the business over ten years.
Technological improvements in logistics could eventually reduce delivery costs enough to weaken the convenience advantage of nearby stores.
Store saturation is another possibility. With more than twenty thousand locations, the company may eventually approach the limits of economically viable expansion in rural markets.
Municipal regulations could also limit growth in certain areas where communities argue that dollar stores discourage full grocery development.
Finally, the financial health of the low income consumer base remains uncertain. Persistent inflation or reductions in government assistance could affect demand.
Despite those risks, the underlying demand for low priced essentials is likely to remain durable. Rural communities will continue to need accessible retail outlets.
Overall, the business appears reasonably predictable over a decade, though margins may fluctuate meaningfully.
Multi-Year Thesis (3 to 7 years):
Bull Case Scenario:
Probability: 35%
Assumptions:
Operating margins recover toward approximately 7% as shrink declines and operational execution improves.
Same store sales grow roughly 3% annually as traffic increases and private label penetration rises.
Store remodel programs materially improve productivity and incremental returns remain strong.
Retail media and digital initiatives add higher margin revenue streams.
Estimated intrinsic value: $300
Base Case Scenario:
Probability: 45%
Assumptions:
Operating margins stabilize around roughly 6%.
Same store sales grow approximately 2% annually supported by steady traffic from value oriented consumers.
Store expansion continues but incremental returns gradually decline as the network matures.
Free cash flow grows in the mid single digits over time.
Estimated intrinsic value: $255
Bear Case Scenario:
Probability: 20%
Assumptions:
Operating margins compress toward roughly 4.5% to 5% due to labor inflation, shrink, and price competition.
Same store sales slow toward roughly 1% growth or lower due to consumer pressure and store saturation.
Incremental store productivity declines meaningfully.
Capital expenditures remain elevated just to maintain store standards.
Estimated intrinsic value: $180
Margin of Safety Verdict:
weighted_intrinsic_value: $255.75
current_price: $110.61
discount_to_weighted_iv: 56.8%
mos_bucket: deep_value
Trading ~56.8% below probability-weighted fair value ($255.75), meeting a strict deep-value margin-of-safety hurdle.
This valuation suggests the market is pricing in either prolonged margin weakness or structural deterioration in the business model. If margins simply stabilize and modest growth continues, today’s price could represent a meaningful undervaluation.
Peak Margin Stress Test:
Dollar General currently operates with gross margins around 30.8% and operating margins near 5.9%.
If operating margins declined to approximately 4.5%, EBIT could fall roughly 20%.
Under that scenario valuation multiples would expand significantly and intrinsic value could compress toward roughly $80 to $90 per share.
That implies potential downside of roughly 15% to 25% from current trading levels if profitability deteriorates materially.
Valuation Framing:
Several frameworks help frame the opportunity.
Free Cash Flow Yield
Trailing free cash flow of approximately $1.88 billion against a market capitalization near $23 billion implies a free cash flow yield near 8%.
Comparable Multiples
The stock trades around 15 times trailing earnings and approximately 11 times EBITDA, a relatively modest valuation for a consumer defensive retailer.
Discounted Cash Flow
Long term models assuming mid single digit free cash flow growth and stable margins produce fair value estimates in the $140 to $160 range under conservative assumptions.
The wide gap between conservative valuations and the probability weighted scenario highlights uncertainty around margin recovery.
Perception vs Reality:
Perception: Dollar General is a declining discount retailer facing structural competition from Walmart and online retail.
Reality: The store network remains dense, demand for low priced essentials remains stable, and many of the company’s operational challenges appear fixable.
Why This May Be Misunderstood:
Investors often underestimate the value of physical retail density.
Thousands of small stores embedded throughout rural communities represent a distribution advantage that cannot be replicated quickly.
At the same time, recent margin pressure may be causing investors to extrapolate short term issues too far into the future.
Three Measurable Things to Watch Next Quarter:
Same store sales growth relative to the long term 2% to 3% framework.
Operating margin progression toward the 6% range.
Free cash flow generation relative to planned capital expenditures.
Historical Conviction Drift:
A decade ago Dollar General was widely viewed as a high quality compounder, supported by consistent store expansion and strong unit economics.
More recently sentiment has cooled as margins compressed and operational issues became more visible.
The current valuation reflects that shift in perception.
Disconfirming Evidence:
The strongest argument against owning the stock is that the historical expansion model may be approaching its limits.
If rural markets are nearing saturation, new stores could increasingly cannibalize existing locations.
Combined with rising labor costs and greater operational complexity, that dynamic could permanently reduce incremental returns on invested capital.
In that scenario Dollar General would begin to resemble a low growth retailer with thin margins and heavy reinvestment requirements.
Risks:
Structural pressure on the low income consumer base.
Potential saturation of rural store markets.
Persistent shrink and theft issues.
Competition from Walmart and other discount retailers.
Improving e commerce logistics that could erode convenience advantages.
Municipal restrictions on new dollar store development.
Summary:
Dollar General remains a straightforward business built on a historically effective strategy: place small, low cost stores close to value oriented consumers and generate steady cash flow from frequent purchases of essential goods.
The investment debate today centers on whether current operational challenges are temporary disruptions or signs of permanent deterioration in the model.
At today’s prices the market appears to be leaning toward the latter.
If management restores operating margins and maintains modest growth, the current valuation could prove overly pessimistic.
If margins remain structurally pressured, what looks like a bargain may instead become a classic value trap.
For disciplined investors, the central question remains simple: does the rural proximity moat still work?
Data Snapshot:
Metric: Price
Metric: Value
Current Price (DG): $106.27
Market Capitalization: $23.44 billion
Shares Outstanding: 220,586,647
Trailing P/E: 15.03x
Forward P/E: 13.38x
Enterprise Value (EV): $37.89 billion
EV/EBITDA: 11.18x
Revenue (TTM): $43.08 billion
Gross Margin: 30.83%
Operating Margin: 5.92%
Free Cash Flow (FCF): $1.88 billion
FCF Yield: 8.03%
52-Week Range: $95.11 to $158.23
Sector: Consumer Defensive
Industry: Discount Stores
Data Freshness: post-earnings Yahoo lag
Reported Earnings Quarter Revenue (event): $10.79 billion
Yahoo Statements Quarter Revenue (prior, stale) (2026-01-31): $10.91 billion
Reported Earnings Quarter FCF (event): $2.16 billion
FCF TTM (may lag): $1.88 billion
Yahoo Statements Quarter Gross Margin: 30.45%
Latest Reported EPS: 2.0 (surprise 6.22%)
Next Quarter Revenue Guide (Yahoo calendar): $11.10 billion to $11.22 billion (avg $11.17 billion)
Analyst Consensus +1q Revenue (NOT company guide): $11.09 billion
Dividend (earnings event): $0.59/quarter
TTM Staleness Flag: TTM revenue/margins/FCF may lag 24-72h after earnings
References:
This analysis reviewed approximately 1126 article sources and 174 video transcripts.
1. Yahoo Finance. Dollar General Corporation (DG) Company Profile and Financial Data. finance.yahoo.com/quote/DG
2. Yahoo Finance. Dollar General Corporation (DG): A Bull Case Theory. finance.yahoo.com/news/dollar-general-corporation-dg-bull-002907823.html
3. Yahoo Finance. Dollar General Corporation (DG): A Bull Case Theory. finance.yahoo.com/news/dollar-general-corporation-dg-bull-163536355.html
4. Yahoo Finance. Dollar General Corporation (DG): A Bull Case Theory. finance.yahoo.com/news/dollar-general-corporation-dg-bull-173839564.html
5. Yahoo Finance. Did Store Remodels and Raised Guidance Just Shift Dollar General’s Investment Narrative. finance.yahoo.com/news/did-store-remodels-raised-guidance-155153997.html
6. GuruFocus. Dollar General Corp Q2 2025 Earnings Call Highlights: Strong Sales Growth and Digital Expansion. finance.yahoo.com/news/dollar-general-corp-dg-q2-070656424.html
7. GuruFocus. Dollar General Corp Q4 2025 Earnings Call Highlights: Strong Sales Growth and Profitability Surge. finance.yahoo.com/news/dollar-general-corp-dg-q4-190335345.html
8. GuruFocus. Dollar General Corp Q1 2026 Earnings Call Highlights: Strong Sales Growth Amid Economic Challenges. ca.finance.yahoo.com/news/dollar-general-corp-dg-q1-210038689.html
9. Simply Wall St. An Intrinsic Calculation For Dollar General Corporation Suggests It Is Undervalued. simplywall.st/stocks/us/consumer-retailing/nyse-dg/dollar-general/news/an-intrinsic-calculation-for-dollar-general-corporation-nyse
10. Macrotrends. Dollar General PE Ratio Historical Data. macrotrends.net/stocks/charts/DG/dollar-general/pe-ratio
11. StockAnalysis. Dollar General Revenue History. stockanalysis.com/stocks/dg/revenue
12. MarketBeat. Dollar General Analyst Price Targets and Forecasts. marketbeat.com/stocks/NYSE/DG/forecast
13. MarketScreener. Dollar General Analyst Consensus Estimates. marketscreener.com/quote/stock/DOLLAR-GENERAL-CORPORATIO-5699818/consensus
14. Public.com. Dollar General PE Ratio Insights. public.com/stocks/dg/pe-ratio
15. StockStory. Dollar General Research Report. stockstory.org/us/stocks/nyse/dg
16. ChartMill. Dollar General Earnings History and Surprise Analysis. chartmill.com/stock/quote/DG/earnings
17. KoalaGains. Dollar General Competitive Analysis. koalagains.com/stocks/NYSE/DG/competition
18. Kavout Market Lens. Why Is Dollar General Stock Sliding Despite Strong Q4 Results. kavout.com/market-lens/why-is-dollar-general-stock-sliding-despite-strong-q4-results
19. YouTube Channels Referenced:
20. EverythingMoney. Dollar General Stock Analysis. youtube.com/watch?v=7IU9YpoRpyg
21. Mark Meldrum. Retail Sector Analysis. youtube.com/watch?v=mH72Rc1Ijgw
22. SmartStockWatch. Dollar General Business Overview. youtube.com/watch?v=G_qgAzZwyeQ
23. Second Order. Dollar General Strategy Breakdown. youtube.com/watch?v=Hps9sp78c6g
24. Charged Alpha Stock Encyclopedia. Dollar General Corporate Overview. youtube.com/watch?v=1uIGTW6Gjx8
Disclaimer:
This analysis is for informational purposes only and does not constitute investment advice. Investors should conduct their own research and consider their financial circumstances before making investment decisions.

Отказ от ответственности
Информация и публикации не предназначены для предоставления и не являются финансовыми, инвестиционными, торговыми или другими видами советов или рекомендаций, предоставленных или одобренных TradingView. Подробнее читайте в Условиях использования.
Отказ от ответственности
Информация и публикации не предназначены для предоставления и не являются финансовыми, инвестиционными, торговыми или другими видами советов или рекомендаций, предоставленных или одобренных TradingView. Подробнее читайте в Условиях использования.