
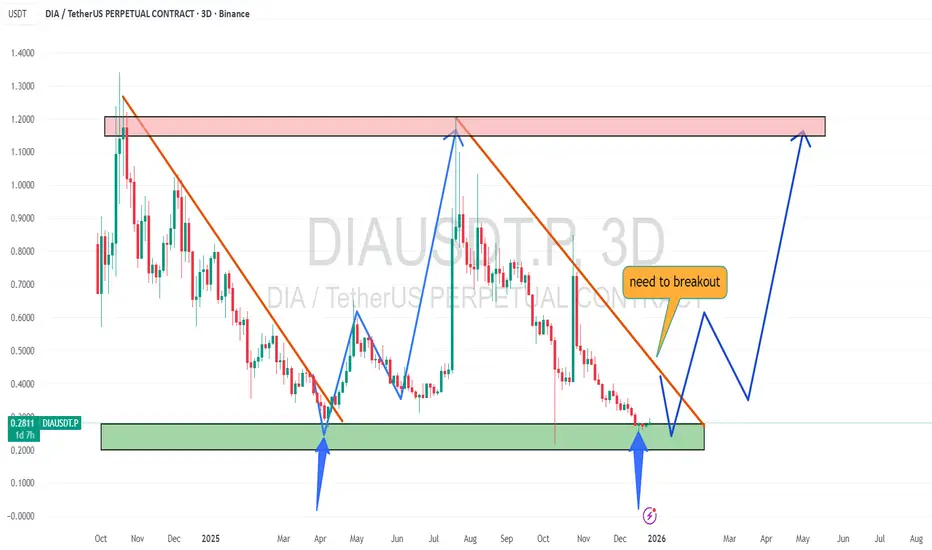
📌This is a 3-day chart, so it shows the higher-timeframe picture. For the last 5 months, price has been in a strong downtrend and dumped heavily 🔻
📌Now price is sitting inside a strong support zone (green area) , In the past, from this same zone, DIA made a massive pump 🚀
📌This support zone has already proven itself once before, and now price is testing it again.
📌Important part to watch:
👉 Price must HOLD this support zone
👉 And then break out above the descending trendline to confirm upside
📌If support holds + trendline breakout happens,
👉 A strong recovery move can start 📈
📌Now price is sitting inside a strong support zone (green area) , In the past, from this same zone, DIA made a massive pump 🚀
📌This support zone has already proven itself once before, and now price is testing it again.
📌Important part to watch:
👉 Price must HOLD this support zone
👉 And then break out above the descending trendline to confirm upside
📌If support holds + trendline breakout happens,
👉 A strong recovery move can start 📈

Join My Free Signal Channel ➡ t.me/Leo524
Отказ от ответственности
Информация и публикации не предназначены для предоставления и не являются финансовыми, инвестиционными, торговыми или другими видами советов или рекомендаций, предоставленных или одобренных TradingView. Подробнее читайте в Условиях использования.
Join My Free Signal Channel ➡ t.me/Leo524
Отказ от ответственности
Информация и публикации не предназначены для предоставления и не являются финансовыми, инвестиционными, торговыми или другими видами советов или рекомендаций, предоставленных или одобренных TradingView. Подробнее читайте в Условиях использования.