
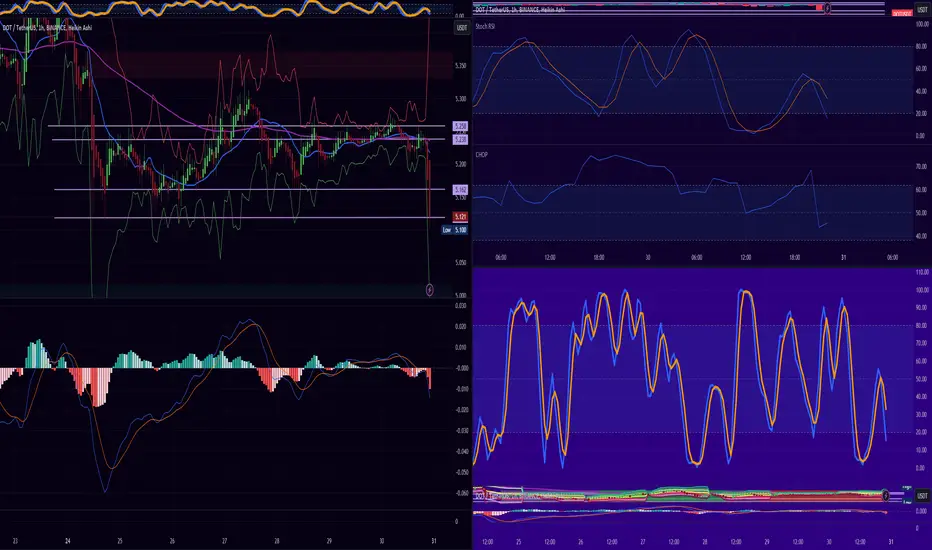
DOT/USDT
Watching these levels can be useful to identify potential entry points: it is currently showing supports at 5,162 and 5,119. This indicates that these are the price levels at which buying pressure has historically entered and reversed a downward trend.
Considered short-term targets or points to consider taking profits:
On the resistance side, we see hurdles at 5,238 and 5,258.
The MACD , a trend-following indicator that shows momentum, is pointing down. This can indicate a downtrend or a loss of momentum in the uptrend.
The RSI , an indicator of momentum, shows exhaustion of selling forces. This could suggest that price action may start to reverse into an uptrend if there are no more bears to push the price lower.
The Chop indicator is at 43.17 which is below 50 which is generally considered a trending market. So, although there is some degree of consolidation, the price is still moving significantly.
Given the "needle" move (a quick downward price move followed by an equally quick rebound) it is possible that price action is bouncing back, these moves are quite common on Sundays in the cryptocurrency market.

Renato Ulianov | Market Analysis & Trading
YouTube: youtube.com/@TradewithRenatoUlianov
Disclaimer: All content is for educational and informational purposes only and does not constitute financial advice.
YouTube: youtube.com/@TradewithRenatoUlianov
Disclaimer: All content is for educational and informational purposes only and does not constitute financial advice.
Отказ от ответственности
Информация и публикации не предназначены для предоставления и не являются финансовыми, инвестиционными, торговыми или другими видами советов или рекомендаций, предоставленных или одобренных TradingView. Подробнее читайте в Условиях использования.