
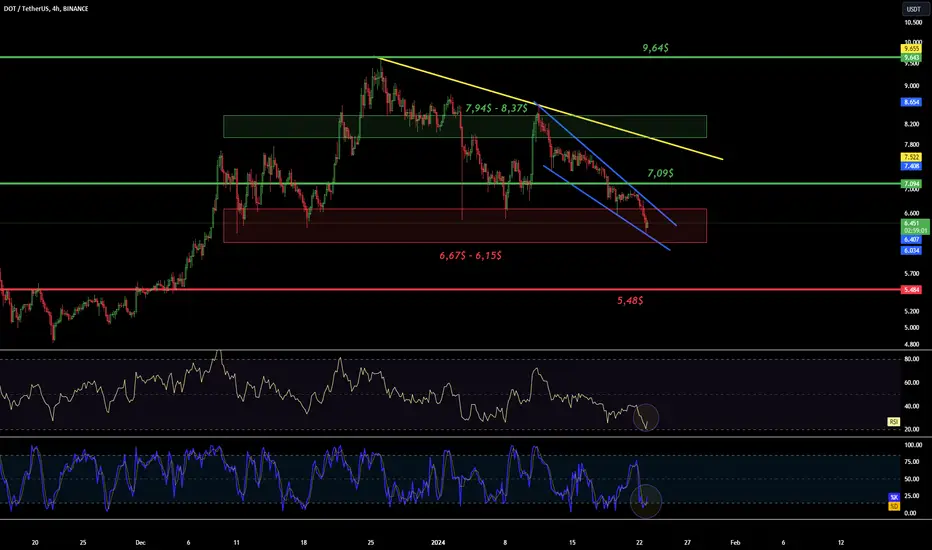
Hello everyone, I invite you to review the chart of DOT in pair with USDT. First, we will use the yellow line to determine the downward trend line, and additionally, we can define the local downward trend channel using the blue lines.
Moving on, we can move on to marking support places using the trend based fib extension grid. And here we have a visible strong support zone with prices ranging from $6.67 to $6.15, but if we break out of this zone, we still have support at $5.48.
Looking the other way, we see resistance at $7.09, then we can mark an important support zone from $7.94 to $8.37, and then we have very strong resistance at $9.64.
It is also worth paying attention to the RSI indicator and the STOCH indicator, where we observe a rebound from the lower limit, which results in a slight price rebound with room for greater growth.
Moving on, we can move on to marking support places using the trend based fib extension grid. And here we have a visible strong support zone with prices ranging from $6.67 to $6.15, but if we break out of this zone, we still have support at $5.48.
Looking the other way, we see resistance at $7.09, then we can mark an important support zone from $7.94 to $8.37, and then we have very strong resistance at $9.64.
It is also worth paying attention to the RSI indicator and the STOCH indicator, where we observe a rebound from the lower limit, which results in a slight price rebound with room for greater growth.

Отказ от ответственности
Информация и публикации не предназначены для предоставления и не являются финансовыми, инвестиционными, торговыми или другими видами советов или рекомендаций, предоставленных или одобренных TradingView. Подробнее читайте в Условиях использования.
Отказ от ответственности
Информация и публикации не предназначены для предоставления и не являются финансовыми, инвестиционными, торговыми или другими видами советов или рекомендаций, предоставленных или одобренных TradingView. Подробнее читайте в Условиях использования.