
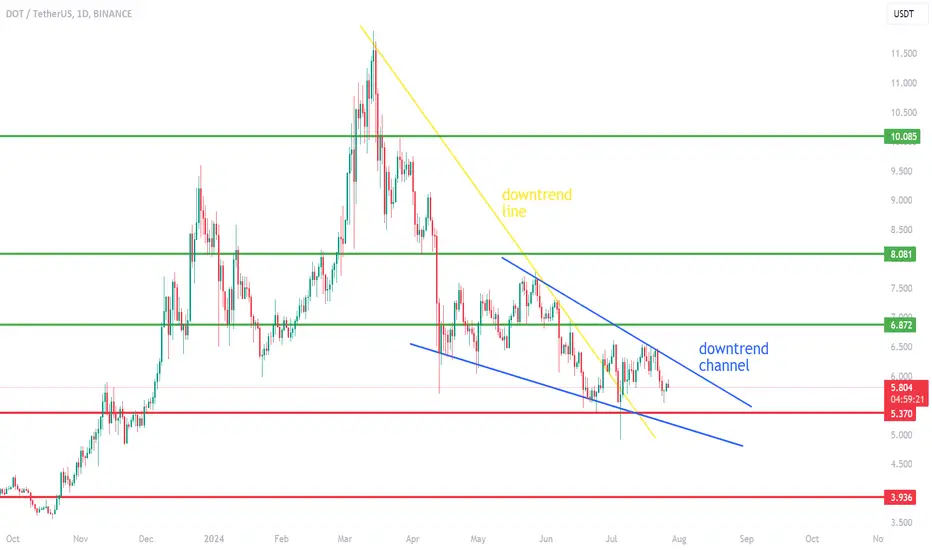
Hello everyone, let's take a look at the BTC to USDT chart on a one-day time frame. We can see that the price has moved sideways from the downtrend line, but there is still movement in the smaller downtrend channel.
Let's start by determining the support line and as you can see, the first support in the near future is $5.37, if the support is broken, the next support is $3.94.
Now let's move on to the resistance line, as you can see the first resistance is at $6.87, if you manage to break it the next resistance will be at $8.08 and then strong resistance at $10.09.
Let's start by determining the support line and as you can see, the first support in the near future is $5.37, if the support is broken, the next support is $3.94.
Now let's move on to the resistance line, as you can see the first resistance is at $6.87, if you manage to break it the next resistance will be at $8.08 and then strong resistance at $10.09.

Отказ от ответственности
Информация и публикации не предназначены для предоставления и не являются финансовыми, инвестиционными, торговыми или другими видами советов или рекомендаций, предоставленных или одобренных TradingView. Подробнее читайте в Условиях использования.
Отказ от ответственности
Информация и публикации не предназначены для предоставления и не являются финансовыми, инвестиционными, торговыми или другими видами советов или рекомендаций, предоставленных или одобренных TradingView. Подробнее читайте в Условиях использования.