
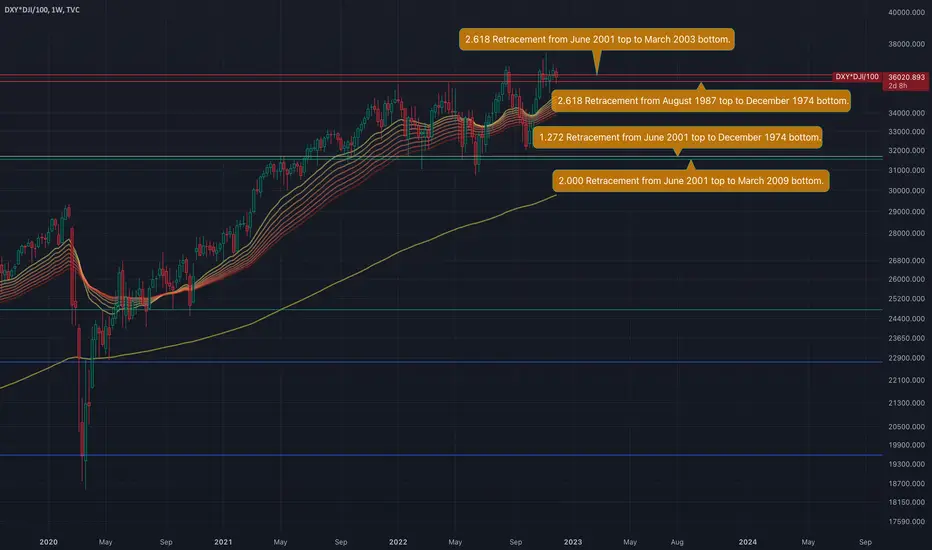
Trapped between these very important retracements. They act as price magnets, and significant support/resistance levels.
These were drawn with the magnet tool, so there is no bias towards their positions.
Do note that we are analyzing the DXY*DJI chart, which shows us a clearer picture of recent price action.
A closeup.

Are we in UTAD?
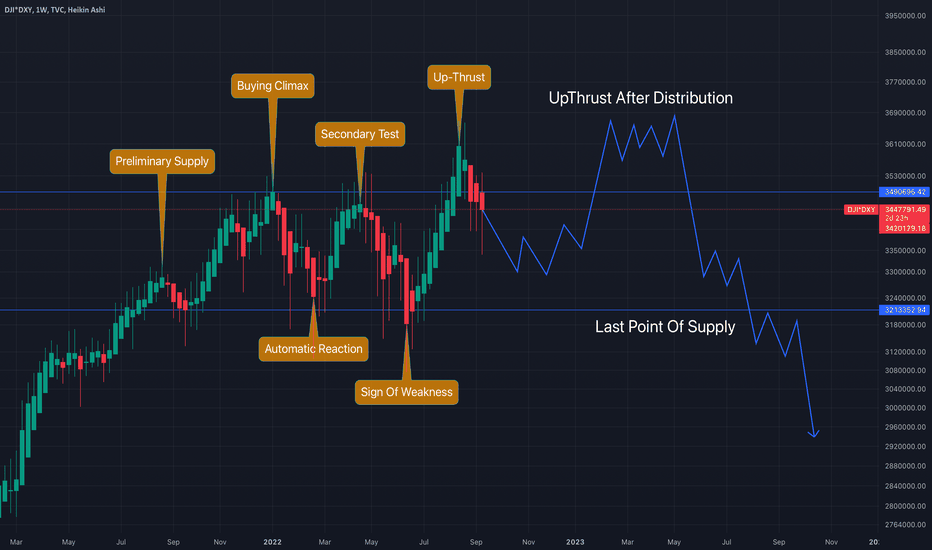
And another beauty...

Tread lightly, for this is hallowed ground.
-Father Grigori
These were drawn with the magnet tool, so there is no bias towards their positions.
Do note that we are analyzing the DXY*DJI chart, which shows us a clearer picture of recent price action.
A closeup.
Are we in UTAD?
And another beauty...
Tread lightly, for this is hallowed ground.
-Father Grigori
Заметка
The violation of this trend marks the end of QE. This shows the true effect. I hope you all understand it.With Green and Red arrows, I have marked the points I used to draw the rays.
These long-term rays, prove as significant resistance.
Hitting one of them, was a fundamental reason the Black Monday was so severe.

Похожие публикации
Отказ от ответственности
Информация и публикации не предназначены для предоставления и не являются финансовыми, инвестиционными, торговыми или другими видами советов или рекомендаций, предоставленных или одобренных TradingView. Подробнее читайте в Условиях использования.
Похожие публикации
Отказ от ответственности
Информация и публикации не предназначены для предоставления и не являются финансовыми, инвестиционными, торговыми или другими видами советов или рекомендаций, предоставленных или одобренных TradingView. Подробнее читайте в Условиях использования.