
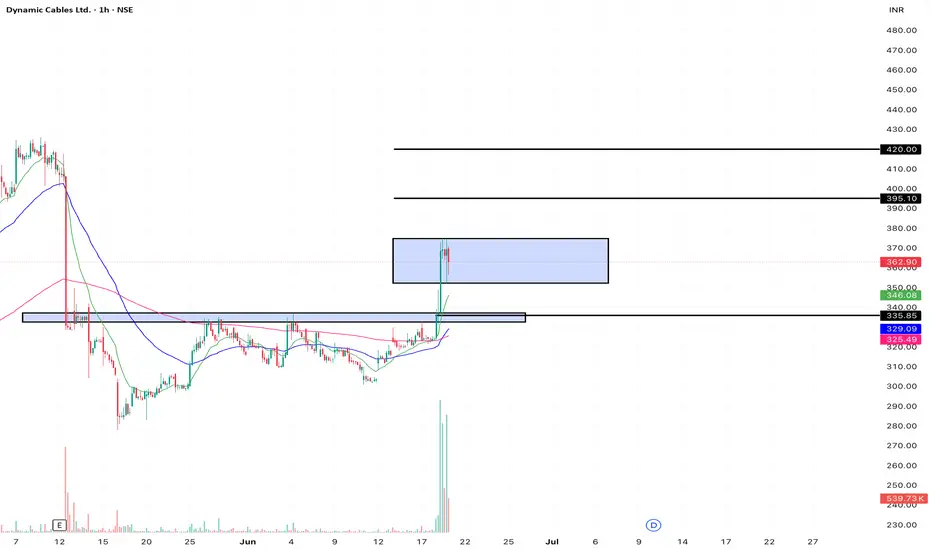
📊 Dynamic Cables Ltd. (DYCL) - 1-Hour (1H) Chart Breakdown
This post is shared for EDUCATIONAL PURPOSES ONLY to analyze horizontal range breakouts and short-term swing structures. This is not financial or investment advice.
🟢 Technical Observations:
1. Horizontal Box Breakout: On the 1H timeframe, DYCL has cleanly broken out of a critical accumulation/resistance zone between 335.00 and 340.00.
2. Volume Validation: The explosive breakout move is backed by a massive influx of volume at the bottom of the chart, confirming strong buyer interest.
3. Current Consolidation: After touching a high around 370.00, the price is currently putting in a minor intraday cool-down (trading around 362.90–366.55). This provides a healthier entry zone rather than chasing the absolute peak.
4. Moving Average Support: The short-term moving averages are sloping sharply upwards, acting as immediate dynamic support just below the price action.
🎯 Educational Swing Setup:
• Entry Zone: 350.00 – 363.00 (Looking for entries on minor 1H pullbacks closer to the upper boundary of the breakout support zone).
• Target 1: 395.00 (Near-term psychological barrier)
• Target 2: 420.00 (Extended momentum target)
• Invalidation / Stop-Loss: 335.00 (A daily close back below the main horizontal breakout box invalidates this bullish structure).
• Expected Duration: 5 to 12 Trading Days (Short-term hourly swing view)
⚠️ Risk Management:
Since the stock has shown high intraday volatility (+12.85% move), maintain strict position sizing. Watch for the 1H candles to stabilize within our support zone before confirming further upside.
This post is shared for EDUCATIONAL PURPOSES ONLY to analyze horizontal range breakouts and short-term swing structures. This is not financial or investment advice.
🟢 Technical Observations:
1. Horizontal Box Breakout: On the 1H timeframe, DYCL has cleanly broken out of a critical accumulation/resistance zone between 335.00 and 340.00.
2. Volume Validation: The explosive breakout move is backed by a massive influx of volume at the bottom of the chart, confirming strong buyer interest.
3. Current Consolidation: After touching a high around 370.00, the price is currently putting in a minor intraday cool-down (trading around 362.90–366.55). This provides a healthier entry zone rather than chasing the absolute peak.
4. Moving Average Support: The short-term moving averages are sloping sharply upwards, acting as immediate dynamic support just below the price action.
🎯 Educational Swing Setup:
• Entry Zone: 350.00 – 363.00 (Looking for entries on minor 1H pullbacks closer to the upper boundary of the breakout support zone).
• Target 1: 395.00 (Near-term psychological barrier)
• Target 2: 420.00 (Extended momentum target)
• Invalidation / Stop-Loss: 335.00 (A daily close back below the main horizontal breakout box invalidates this bullish structure).
• Expected Duration: 5 to 12 Trading Days (Short-term hourly swing view)
⚠️ Risk Management:
Since the stock has shown high intraday volatility (+12.85% move), maintain strict position sizing. Watch for the 1H candles to stabilize within our support zone before confirming further upside.

Отказ от ответственности
Информация и публикации не предназначены для предоставления и не являются финансовыми, инвестиционными, торговыми или другими видами советов или рекомендаций, предоставленных или одобренных TradingView. Подробнее читайте в Условиях использования.
Отказ от ответственности
Информация и публикации не предназначены для предоставления и не являются финансовыми, инвестиционными, торговыми или другими видами советов или рекомендаций, предоставленных или одобренных TradingView. Подробнее читайте в Условиях использования.