
Yello, Paradisers! Could #EGLD be preparing for another explosive rally while most traders are still distracted by short-term market uncertainty? After its previous impulsive move, #EGLD is now approaching a crucial technical zone that could determine whether the next major bullish expansion is about to begin.
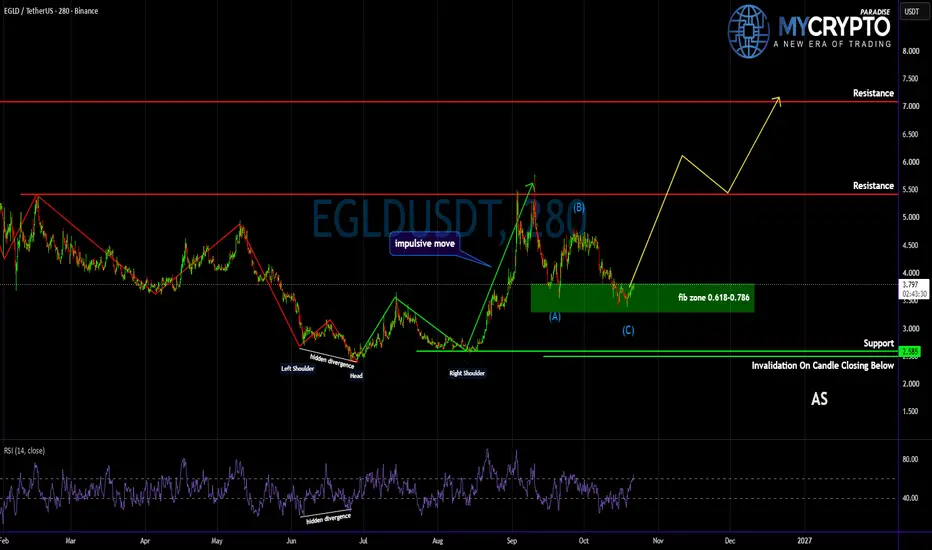
💎#EGLD has already demonstrated significant bullish strength following the formation of an Inverse Head and Shoulders pattern, supported by hidden bullish RSI divergence. This combination helped establish a potential long-term market reversal, followed by a powerful impulsive rally toward the $5.50 resistance area.
💎However, as experienced traders know, markets rarely move in a straight line. After such an aggressive bullish expansion, a corrective phase is not only normal but often necessary before the next sustainable move higher.
💎The current price structure suggests that #EGLD may be completing an ABC correction, with the potential C-wave bottom forming inside the 0.618–0.786 Fibonacci retracement zone, approximately between $3.30 and $3.80. This area represents an important technical demand zone where buyers could regain control and establish the foundation for another bullish impulse.
💎What makes the current setup particularly interesting is that #EGLD is already showing signs of stabilization around this Fibonacci support area. If buyers successfully defend this zone and bullish momentum continues to strengthen, the probability of another upward expansion could increase significantly.
💎The first major upside target is the $5.50 resistance level, which previously rejected the bullish advance. A decisive breakout and sustained move above this resistance would strengthen the bullish continuation scenario and potentially open the door toward the next significant resistance around $7.10.
💎From the current price near $3.80, this represents approximately 87% potential upside if the entire bullish scenario develops successfully.
💎Nevertheless, a technically attractive setup is never a guarantee. The critical invalidation level remains $2.585, and a confirmed candle close below this structural support would invalidate the bullish scenario illustrated on the chart and require a reassessment of the market structure.
That is why Paradisers, we are playing it safe right now. If you want to be consistently profitable, you need to be extremely patient and always wait only for the best, highest probability trading opportunities only on confirmations.
MyCryptoParadise
iFeel the success🌴
💎#EGLD has already demonstrated significant bullish strength following the formation of an Inverse Head and Shoulders pattern, supported by hidden bullish RSI divergence. This combination helped establish a potential long-term market reversal, followed by a powerful impulsive rally toward the $5.50 resistance area.
💎However, as experienced traders know, markets rarely move in a straight line. After such an aggressive bullish expansion, a corrective phase is not only normal but often necessary before the next sustainable move higher.
💎The current price structure suggests that #EGLD may be completing an ABC correction, with the potential C-wave bottom forming inside the 0.618–0.786 Fibonacci retracement zone, approximately between $3.30 and $3.80. This area represents an important technical demand zone where buyers could regain control and establish the foundation for another bullish impulse.
💎What makes the current setup particularly interesting is that #EGLD is already showing signs of stabilization around this Fibonacci support area. If buyers successfully defend this zone and bullish momentum continues to strengthen, the probability of another upward expansion could increase significantly.
💎The first major upside target is the $5.50 resistance level, which previously rejected the bullish advance. A decisive breakout and sustained move above this resistance would strengthen the bullish continuation scenario and potentially open the door toward the next significant resistance around $7.10.
💎From the current price near $3.80, this represents approximately 87% potential upside if the entire bullish scenario develops successfully.
💎Nevertheless, a technically attractive setup is never a guarantee. The critical invalidation level remains $2.585, and a confirmed candle close below this structural support would invalidate the bullish scenario illustrated on the chart and require a reassessment of the market structure.
That is why Paradisers, we are playing it safe right now. If you want to be consistently profitable, you need to be extremely patient and always wait only for the best, highest probability trading opportunities only on confirmations.
MyCryptoParadise
iFeel the success🌴

Want to trade like a PRO without the 15+ year learning curve?
🫳Steal the edge - follow seasoned team of traders at mycryptoparadise.com (FREE)
🎖️Or go full throttle with PRO strategy + killer entry/exit signals - t.me/MCPsupportbot
🫳Steal the edge - follow seasoned team of traders at mycryptoparadise.com (FREE)
🎖️Or go full throttle with PRO strategy + killer entry/exit signals - t.me/MCPsupportbot
Отказ от ответственности
Информация и публикации не предназначены для предоставления и не являются финансовыми, инвестиционными, торговыми или другими видами советов или рекомендаций, предоставленных или одобренных TradingView. Подробнее читайте в Условиях использования.
Want to trade like a PRO without the 15+ year learning curve?
🫳Steal the edge - follow seasoned team of traders at mycryptoparadise.com (FREE)
🎖️Or go full throttle with PRO strategy + killer entry/exit signals - t.me/MCPsupportbot
🫳Steal the edge - follow seasoned team of traders at mycryptoparadise.com (FREE)
🎖️Or go full throttle with PRO strategy + killer entry/exit signals - t.me/MCPsupportbot
Отказ от ответственности
Информация и публикации не предназначены для предоставления и не являются финансовыми, инвестиционными, торговыми или другими видами советов или рекомендаций, предоставленных или одобренных TradingView. Подробнее читайте в Условиях использования.