Короткая
EOS Weekly Re-Distribution
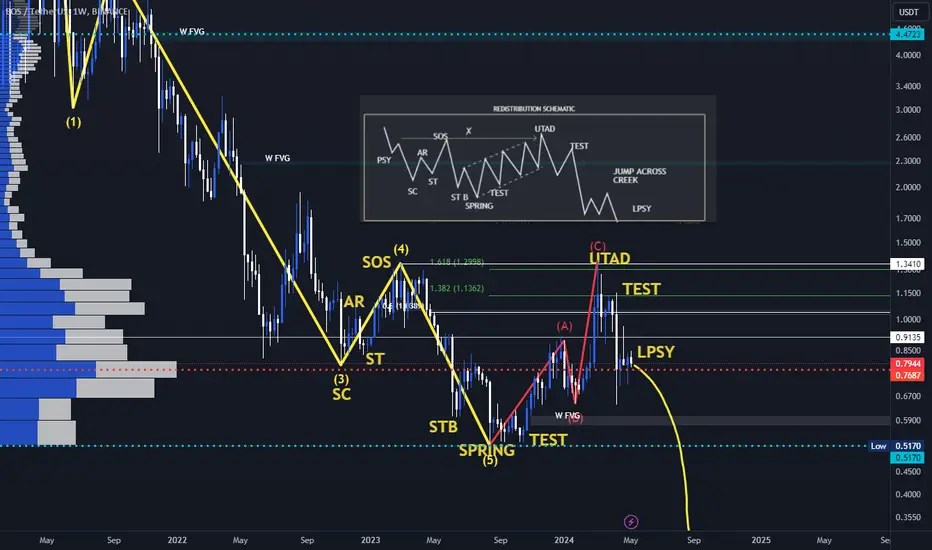
This is the EOS weekly chart, side by side with a re-distribution schematic. If you zoom out you'll also notice that I highlighted the 5 wave impulsive structure to the downside that we had during the bear market, and how this ABC correction took out the wave 4 highs, exactly how it's supposed to before a continuation would begin. The monthly indicators all look extremely bearish as well, on most of the altcoins actually.
I would recommend pulling your capital and saving it to buy lower prices, as I do believe that's where we are headed.
I would recommend pulling your capital and saving it to buy lower prices, as I do believe that's where we are headed.

Premium Signals Group: patreon.com/DigiLex
Похожие публикации
Отказ от ответственности
Информация и публикации не предназначены для предоставления и не являются финансовыми, инвестиционными, торговыми или другими видами советов или рекомендаций, предоставленных или одобренных TradingView. Подробнее читайте в Условиях использования.
Premium Signals Group: patreon.com/DigiLex
Похожие публикации
Отказ от ответственности
Информация и публикации не предназначены для предоставления и не являются финансовыми, инвестиционными, торговыми или другими видами советов или рекомендаций, предоставленных или одобренных TradingView. Подробнее читайте в Условиях использования.