
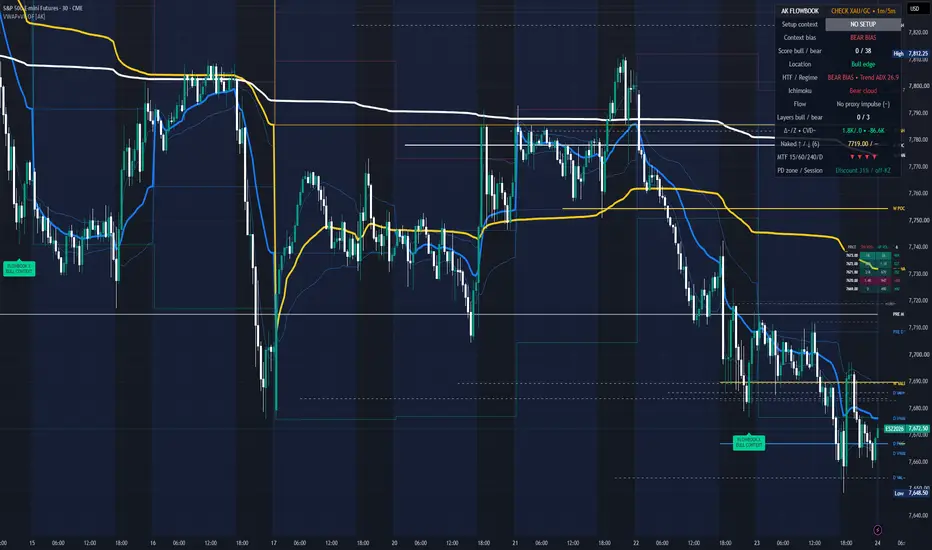
Two simple Market Profile tools tell you, period by period, who is in control of the auction: rotation factor and one-time framing. Below are the definitions, a live example from Friday's S&P futures session, and how they behaved over the last 22 sessions.
Data: CME E-mini S&P 500 futures (ES, December contract), 5-minute bars grouped into 30-minute periods, US cash session only (13:30-20:00 UTC, 13 periods). Volume levels on the chart come from the VWAP & Volume Profile Order Flow Map [AK FlowBook] indicator.
1) Rotation factor (RF)
Compare each 30-minute period with the one before it:
- high above the previous high: +1, below: -1, equal: 0
- low above the previous low: +1, below: -1, equal: 0
Add it up through the session. A strongly positive RF means buyers keep pushing both ends of the range higher; strongly negative means sellers do; a number near zero means the auction is rotating, not trending.
2) One-time framing (OTF)
- OTF up: every period holds a low at or above the previous period's low.
- OTF down: every period holds a high at or below the previous period's high.
While a market one-time-frames, only one side is active. The first period that takes out the opposite extreme ends it.
Live example: ES, Friday 23 Oct
- Open 7,661, 45.5 points below Thursday's cash close of 7,706.5.
- 14:00 period: low 7,648.5, the low of the day (inside target 1 of our S&P forecast that week).
- 14:00-16:00: OTF up. Lows 7,648.5, 7,655.25, 7,679.75, 7,681.25. Three periods in a row scored +2.
- 16:00: the period low 7,676.25 broke the previous 7,681.25. OTF up ended at the high 7,697.25.
- 15:30-20:00: highs 7,697.25, 7,693.75, 7,690.5, 7,677.5, 7,677.25, 7,675, 7,673.5, 7,671.25, 7,667.5. Every high lower than the one before, eight periods in a row: one-time framing down all afternoon, even though several lows held (scores of 0 at 17:30, 18:00 and 19:00).
- Session RF: -4. Close about 7,661, right back at the open.
So the morning buyers won the first two hours, then sellers framed the auction lower for four hours. The close-vs-open line says "flat day"; RF and OTF tell you who was really in charge, and when it changed.
What 22 sessions say (24 Sep - 23 Oct, cash session)
- RF sign matched the session direction (close vs open) on 15 of the 20 days where RF was not zero.
- Days with |RF| of 8 or more: 7, and 6 of them closed in the RF direction.
- Days that one-time-framed for at least the first 3 periods after the open: 8, and 7 of them closed in that direction (the exception was 13 Oct).
- Examples: 29 Sep framed down for 7 periods, closed 25 points under the open. 9 Oct framed up for 6 periods, closed 23 points above.
Small sample, one market, so treat these as tendencies, not rules.
Checklist
1. Mark each 30-minute period's high and low; score +1/-1 for each end.
2. Watch the running RF: big absolute numbers (+/-8 and beyond) are trend days.
3. Note whether the market is one-time framing, and in which direction.
4. The first period that breaks the opposite extreme is the earliest sign the other side stepped in.
5. Combine with location: OTF away from value is stronger than OTF inside yesterday's value.
Education, not a signal.

AK Order Flow · Gold order flow & volume education
Free Lite indicator + daily XAUUSD levels: akorderflow.com
Telegram: t.me/akorderflow · YouTube: @AKORDERFLOW
Education only, no signals.
Free Lite indicator + daily XAUUSD levels: akorderflow.com
Telegram: t.me/akorderflow · YouTube: @AKORDERFLOW
Education only, no signals.
Отказ от ответственности
Информация и публикации не предназначены для предоставления и не являются финансовыми, инвестиционными, торговыми или другими видами советов или рекомендаций, предоставленных или одобренных TradingView. Подробнее читайте в Условиях использования.