
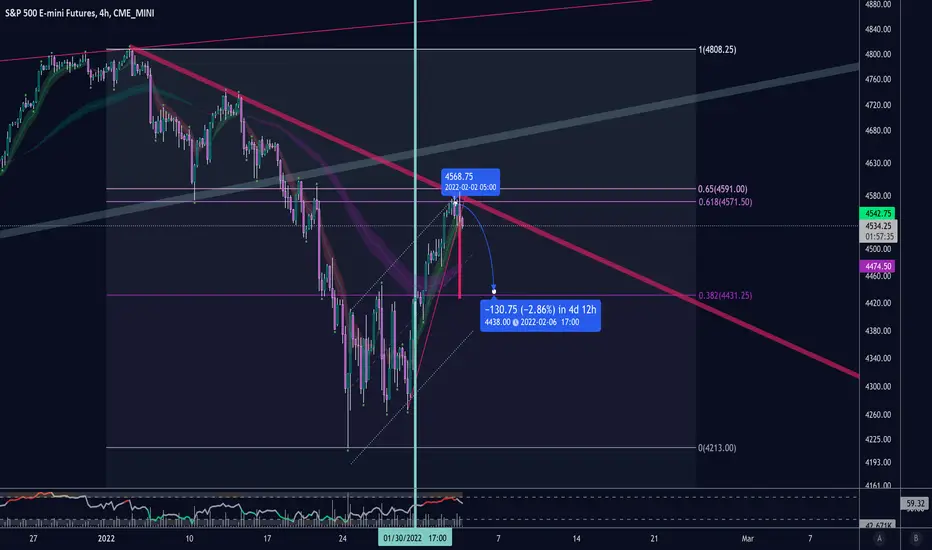
Tom Demark famously described TD supply and demand lines. In doing so, he also described tendency for price action to involve symmetry upon the upward or downward break of a trendline.
In this case, price has broke downward from the most recent TD demand line. Demark provides a step-wise approach to project price based on trend break. In essence, take the absolute highest (lowest) top from the trendline and resolve that distance at the exact point of trend break.
Extrapolating this method, we see that the projected price is approximately 4430-40 which also is the backtest of the recent breakout.
On higher time frames, the exact bottom of this recent trend could be predicted by extrapolating the distance from the TD demand line on November 5, 2021 to the breakdown on January 18, 2022 which gives approximately 350 points down, which is where price settled and reversed.
In this case, price has broke downward from the most recent TD demand line. Demark provides a step-wise approach to project price based on trend break. In essence, take the absolute highest (lowest) top from the trendline and resolve that distance at the exact point of trend break.
Extrapolating this method, we see that the projected price is approximately 4430-40 which also is the backtest of the recent breakout.
On higher time frames, the exact bottom of this recent trend could be predicted by extrapolating the distance from the TD demand line on November 5, 2021 to the breakdown on January 18, 2022 which gives approximately 350 points down, which is where price settled and reversed.

Отказ от ответственности
Информация и публикации не предназначены для предоставления и не являются финансовыми, инвестиционными, торговыми или другими видами советов или рекомендаций, предоставленных или одобренных TradingView. Подробнее читайте в Условиях использования.
Отказ от ответственности
Информация и публикации не предназначены для предоставления и не являются финансовыми, инвестиционными, торговыми или другими видами советов или рекомендаций, предоставленных или одобренных TradingView. Подробнее читайте в Условиях использования.