
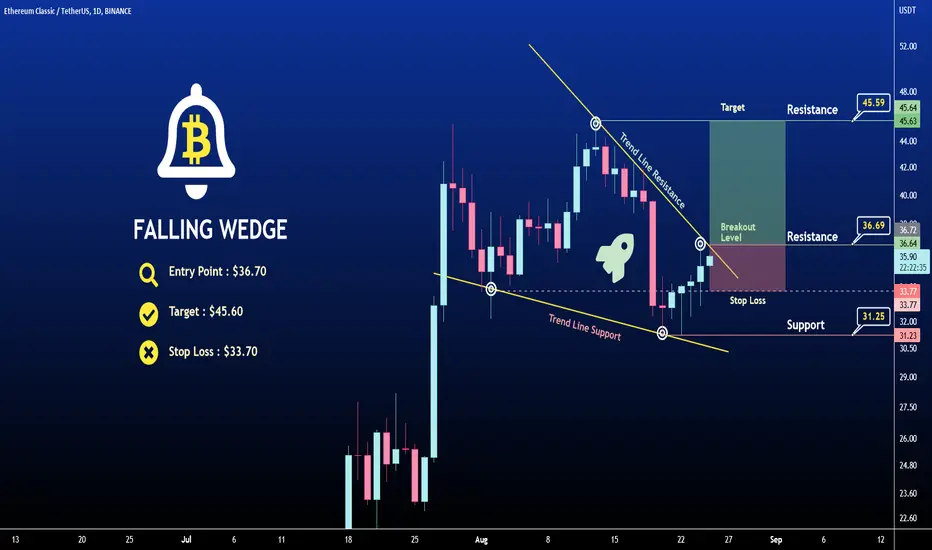
The above chart of Ethereum Classic (ETC) laid out the falling wedge pattern. In a falling wedge pattern, both the upper trend line which connects the highs and the lower trend line which connects the lows converge downwards. The wedge pattern in general indicates a trend reversal. Especially, the falling wedge signals a bullish reversal.
This pattern indicates a breakout in the price trend towards an upswing. From the above chart, we can interpret that the momentum of the downtrend is slowing down.
Currently, Ethereum Classic (ETC) is in the range of $35.80. If the pattern continues, the price of Ethereum Classic (ETC)might reach the resistance levels of $45.60 If the trend reverses, then the price of Ethereum Classic (ETC) may fall to $33.70
✅Trade Level
Entry Point : $36.70
Target : $45.60
Stop Loss : $33.70
Happy Trading
This pattern indicates a breakout in the price trend towards an upswing. From the above chart, we can interpret that the momentum of the downtrend is slowing down.
Currently, Ethereum Classic (ETC) is in the range of $35.80. If the pattern continues, the price of Ethereum Classic (ETC)might reach the resistance levels of $45.60 If the trend reverses, then the price of Ethereum Classic (ETC) may fall to $33.70
✅Trade Level
Entry Point : $36.70
Target : $45.60
Stop Loss : $33.70
Happy Trading

Похожие публикации
Отказ от ответственности
Информация и публикации не предназначены для предоставления и не являются финансовыми, инвестиционными, торговыми или другими видами советов или рекомендаций, предоставленных или одобренных TradingView. Подробнее читайте в Условиях использования.
Похожие публикации
Отказ от ответственности
Информация и публикации не предназначены для предоставления и не являются финансовыми, инвестиционными, торговыми или другими видами советов или рекомендаций, предоставленных или одобренных TradingView. Подробнее читайте в Условиях использования.