
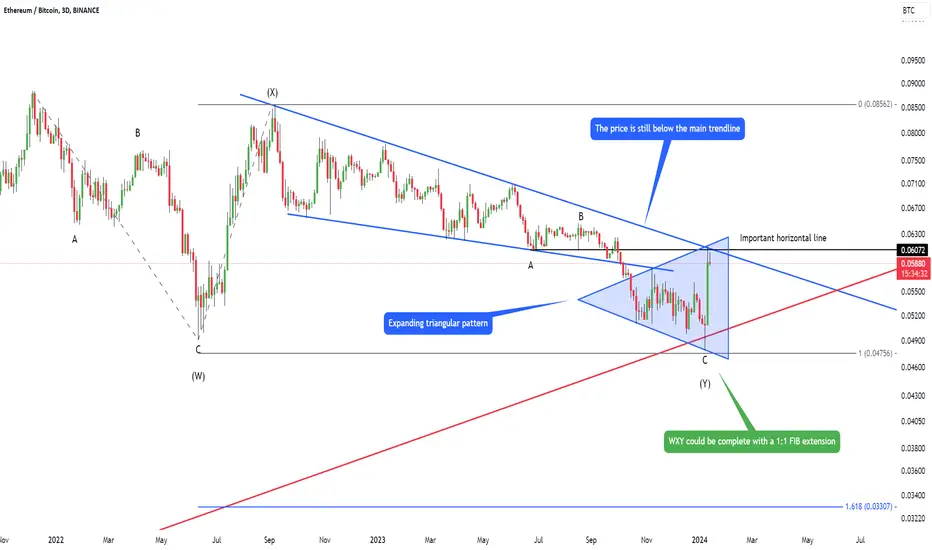
Is it better to hold Ethereum or Bitcoin? If you are interested in such question, you probably want to see the ETHBTC chart. My analysis is on the weekly chart. What we can see is that the ETHBTC formed a WXY Elliott Wave corrective pattern with a 1:1 FIB extension. If this pattern confirms, ETHBTC could reach a new high and pump massively. But the price is still below the main trendline and below the main horizontal line. I recommend waiting for these 2 lines to break to confirm the bullish bias. Otherwise on the weekly chart price makes lower lows and lower highs, which is a sign of a downtrend. Also, what we need to consider is this local expanding triangular formation. Let me know what you think about my analysis, and please hit boost and follow for more ideas. Trading is not hard if you have a good coach! Thank you, and I wish you successful trades.
Заметка
Zoom in - Daily chart
💡Join my VIP group (signals, my trades)
xanrox.org/vip
✅Trade here, support all countries
bitunix.com/register?vipCode=c1vK
xanrox.org/vip
✅Trade here, support all countries
bitunix.com/register?vipCode=c1vK
Отказ от ответственности
Информация и публикации не предназначены для предоставления и не являются финансовыми, инвестиционными, торговыми или другими видами советов или рекомендаций, предоставленных или одобренных TradingView. Подробнее читайте в Условиях использования.
💡Join my VIP group (signals, my trades)
xanrox.org/vip
✅Trade here, support all countries
bitunix.com/register?vipCode=c1vK
xanrox.org/vip
✅Trade here, support all countries
bitunix.com/register?vipCode=c1vK
Отказ от ответственности
Информация и публикации не предназначены для предоставления и не являются финансовыми, инвестиционными, торговыми или другими видами советов или рекомендаций, предоставленных или одобренных TradingView. Подробнее читайте в Условиях использования.