Короткая
Bearish Symmetric Triangle Inbound!!
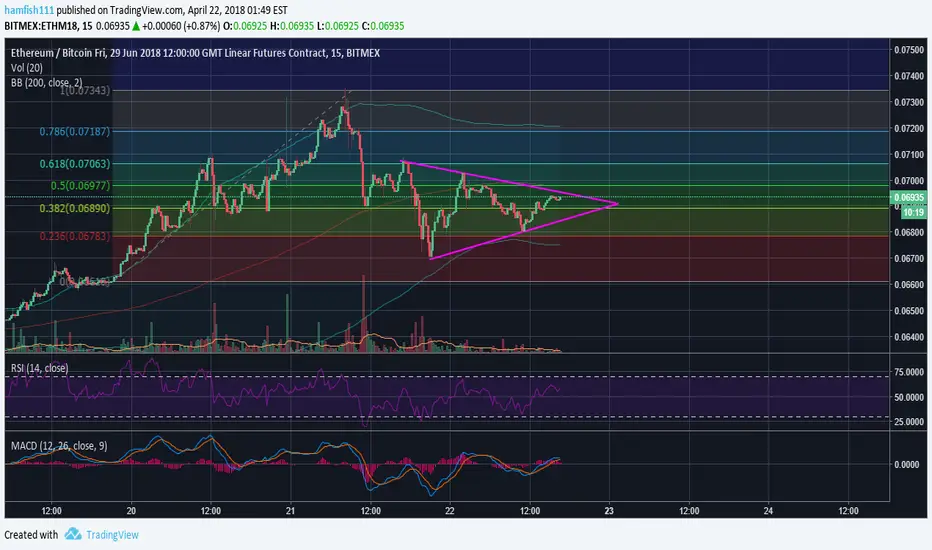
Looking at Ethereum you can see a very noticeable bearish symmetric triangle, some people may get this mixed up with a pennant but the difference between the two is that with a bearish triangle, the price starts from the high point, whereas a pennant starts from the low point.
And also looking at the MACD a crossover seems very possible to the bearish side, and the RSI looks to form a head and shoulders pattern which is also a bearish signal.
Thanks, if you liked my idea dont forget to like it and follow me for more ideas!
And also looking at the MACD a crossover seems very possible to the bearish side, and the RSI looks to form a head and shoulders pattern which is also a bearish signal.
Thanks, if you liked my idea dont forget to like it and follow me for more ideas!
Заметка
i dont even understand
Отказ от ответственности
Информация и публикации не предназначены для предоставления и не являются финансовыми, инвестиционными, торговыми или другими видами советов или рекомендаций, предоставленных или одобренных TradingView. Подробнее читайте в Условиях использования.
Отказ от ответственности
Информация и публикации не предназначены для предоставления и не являются финансовыми, инвестиционными, торговыми или другими видами советов или рекомендаций, предоставленных или одобренных TradingView. Подробнее читайте в Условиях использования.