
Ethereum: A High-Confluence Setup at a Multi-Year Decision Point
Ethereum has reached what I believe is one of the most important technical inflection points of this cycle.
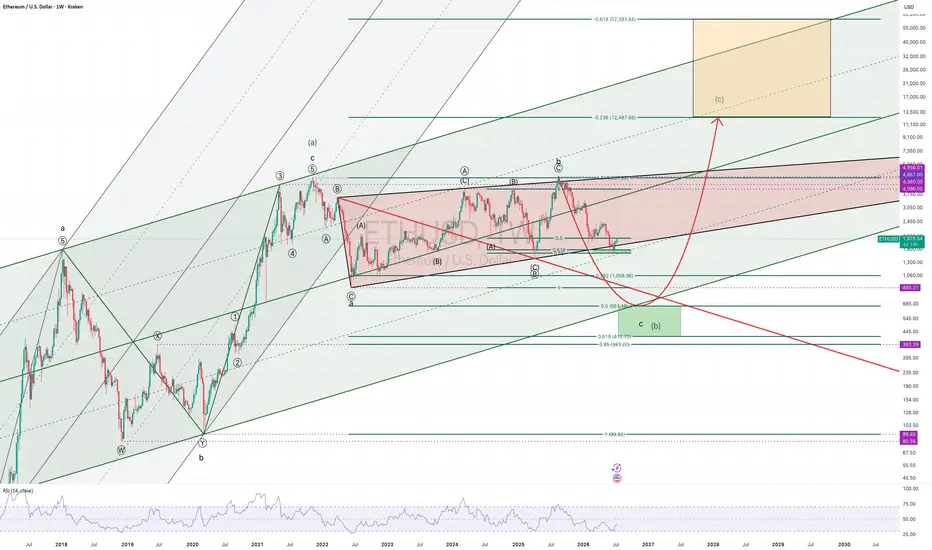
My primary Elliott Wave count suggests that the market is completing a complex multi-year corrective structure rather than beginning a new secular bear market. The current decline is approaching a major confluence zone where long-term channel support, the 0.5-0.618 Fibonacci retracement, and structural price support converge.
Adding further weight to this scenario is the presence of a bullish Wolfe Wave. While Elliott Wave remains the foundation of this analysis, the Wolfe Wave provides an independent geometric framework that points toward a similar reversal area. When different methodologies arrive at the same conclusion, I tend to pay attention.
The key question now is whether the decline from the August 2025 high is corrective or impulsive.
My preferred interpretation is that it is impulsive, favouring one final capitulation into the highlighted support zone around the $700 region before the larger bullish sequence begins. This remains the primary count unless price action proves otherwise.
An alternative scenario still exists. Ethereum could continue developing a large triangle, eventually producing a third test of the $4,900 resistance area before completing the correction. While this remains technically valid, I currently assign it a lower probability, as the decline appears to possess impulsive characteristics rather than the overlapping structure typically associated with triangles.
Should the preferred count unfold, the completion of wave (b) would open the door to a powerful wave (c) advance.
As always with Elliott Wave, the final upside target cannot be defined with precision this early. A normal fifth wave could terminate near the 0.236 Fibonacci extension around $12,500, while an extended fifth wave—something far from unusual in cryptocurrencies—could continue toward the 0.618 extension, currently projected near $57,000. The long-term ascending channel provides the dynamic framework for these objectives, meaning the ultimate target will evolve as the trend develops.
For now, the focus is not on the final destination but on whether Ethereum can complete this correction within the highlighted support region. If that happens, the risk-to-reward profile could become exceptionally attractive for long-term investors.
As always, Elliott Wave analysis is a probabilistic framework rather than a prediction. This is my preferred count, supported by Fibonacci confluence, long-term channel geometry, and a bullish Wolfe Wave. If future price action invalidates this scenario, the alternative count will take precedence.
Not financial advice. Like and follow for more Elliott Wave and macro crypto analysis.
Ethereum has reached what I believe is one of the most important technical inflection points of this cycle.
My primary Elliott Wave count suggests that the market is completing a complex multi-year corrective structure rather than beginning a new secular bear market. The current decline is approaching a major confluence zone where long-term channel support, the 0.5-0.618 Fibonacci retracement, and structural price support converge.
Adding further weight to this scenario is the presence of a bullish Wolfe Wave. While Elliott Wave remains the foundation of this analysis, the Wolfe Wave provides an independent geometric framework that points toward a similar reversal area. When different methodologies arrive at the same conclusion, I tend to pay attention.
The key question now is whether the decline from the August 2025 high is corrective or impulsive.
My preferred interpretation is that it is impulsive, favouring one final capitulation into the highlighted support zone around the $700 region before the larger bullish sequence begins. This remains the primary count unless price action proves otherwise.
An alternative scenario still exists. Ethereum could continue developing a large triangle, eventually producing a third test of the $4,900 resistance area before completing the correction. While this remains technically valid, I currently assign it a lower probability, as the decline appears to possess impulsive characteristics rather than the overlapping structure typically associated with triangles.
Should the preferred count unfold, the completion of wave (b) would open the door to a powerful wave (c) advance.
As always with Elliott Wave, the final upside target cannot be defined with precision this early. A normal fifth wave could terminate near the 0.236 Fibonacci extension around $12,500, while an extended fifth wave—something far from unusual in cryptocurrencies—could continue toward the 0.618 extension, currently projected near $57,000. The long-term ascending channel provides the dynamic framework for these objectives, meaning the ultimate target will evolve as the trend develops.
For now, the focus is not on the final destination but on whether Ethereum can complete this correction within the highlighted support region. If that happens, the risk-to-reward profile could become exceptionally attractive for long-term investors.
As always, Elliott Wave analysis is a probabilistic framework rather than a prediction. This is my preferred count, supported by Fibonacci confluence, long-term channel geometry, and a bullish Wolfe Wave. If future price action invalidates this scenario, the alternative count will take precedence.
Not financial advice. Like and follow for more Elliott Wave and macro crypto analysis.
Заметка
Secondary Triangle Alternative EWP Count
In technical analysis, several methods focus on higher timeframes to provide a broader, more reliable context for trading or investment decisions. Elliott Wave Principle generally considers historical higher timeframes as mandatory.
Похожие публикации
Отказ от ответственности
Информация и публикации не предназначены для предоставления и не являются финансовыми, инвестиционными, торговыми или другими видами советов или рекомендаций, предоставленных или одобренных TradingView. Подробнее читайте в Условиях использования.
In technical analysis, several methods focus on higher timeframes to provide a broader, more reliable context for trading or investment decisions. Elliott Wave Principle generally considers historical higher timeframes as mandatory.
Похожие публикации
Отказ от ответственности
Информация и публикации не предназначены для предоставления и не являются финансовыми, инвестиционными, торговыми или другими видами советов или рекомендаций, предоставленных или одобренных TradingView. Подробнее читайте в Условиях использования.