
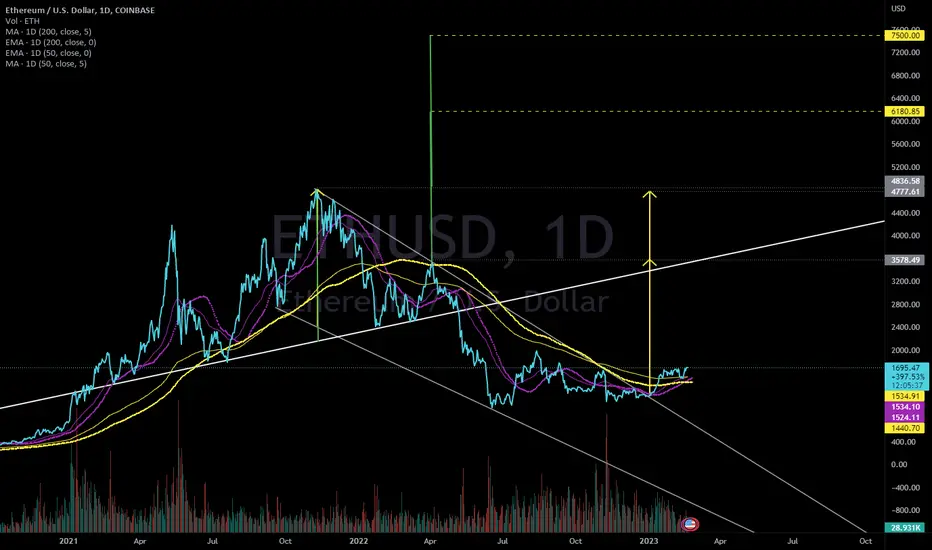
Ethereum broke out of a falling wedge and is showing a golden cross on the 50/200 day MA (dotted), and approaching the same on the 50/200 EMA.
Its falling wedge TP 1 lies right around the neckline of a Head and Shoulders pattern that we fell below during Spring of 2022, as well as the right shoulder.
Falling wedge TP 2 lies just near previous ATH. Get above right shoulder to trigger failed HS, get above ATH to head to 6180 and ultimately 7500.
Note - a successful HS would take Eth back to 0 on its first measured target, so which is more likely - 0 or 7500 following the swap to proof of stake?
Its falling wedge TP 1 lies right around the neckline of a Head and Shoulders pattern that we fell below during Spring of 2022, as well as the right shoulder.
Falling wedge TP 2 lies just near previous ATH. Get above right shoulder to trigger failed HS, get above ATH to head to 6180 and ultimately 7500.
Note - a successful HS would take Eth back to 0 on its first measured target, so which is more likely - 0 or 7500 following the swap to proof of stake?
Заметка
Seeing a lot a bearish posts on ETH, but it's doing what BTC and everything else has been - broke out of a long-term falling wedge, moved up, golden cross on 50/200 day MA, successfully stayed above both on a re-test, now a 50/200 day EMA golden cross as well:
Отказ от ответственности
Информация и публикации не предназначены для предоставления и не являются финансовыми, инвестиционными, торговыми или другими видами советов или рекомендаций, предоставленных или одобренных TradingView. Подробнее читайте в Условиях использования.
Отказ от ответственности
Информация и публикации не предназначены для предоставления и не являются финансовыми, инвестиционными, торговыми или другими видами советов или рекомендаций, предоставленных или одобренных TradingView. Подробнее читайте в Условиях использования.