
Following up on this initial Bullish idea on the 4 Hour: 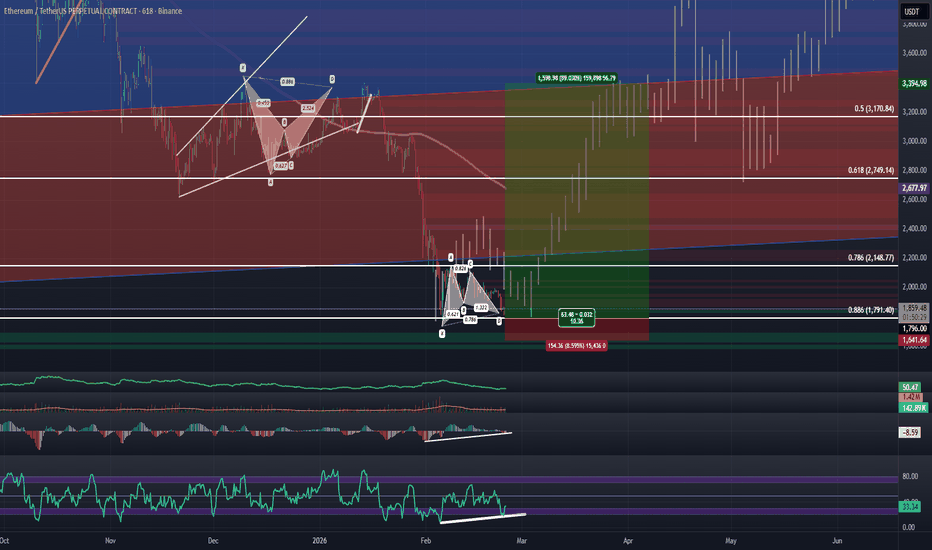
and this Bullish idea on the daily: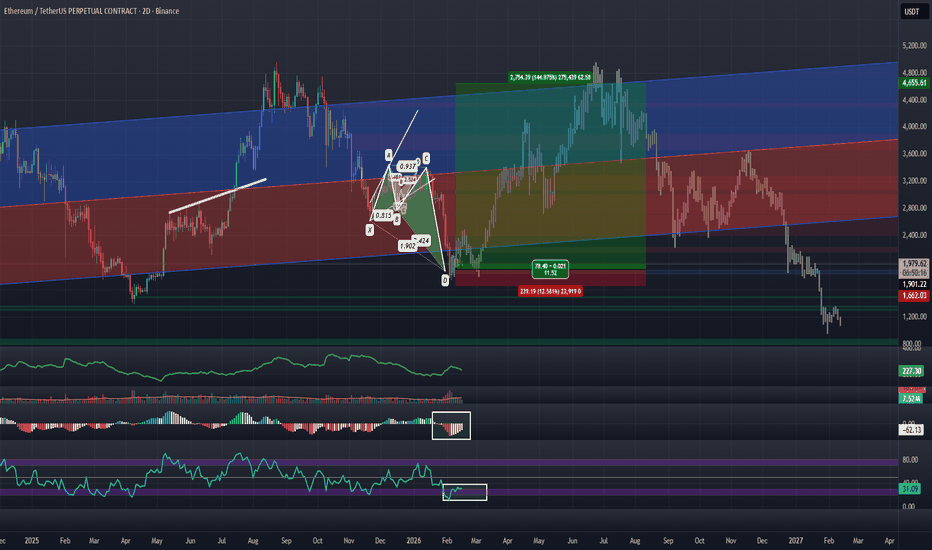
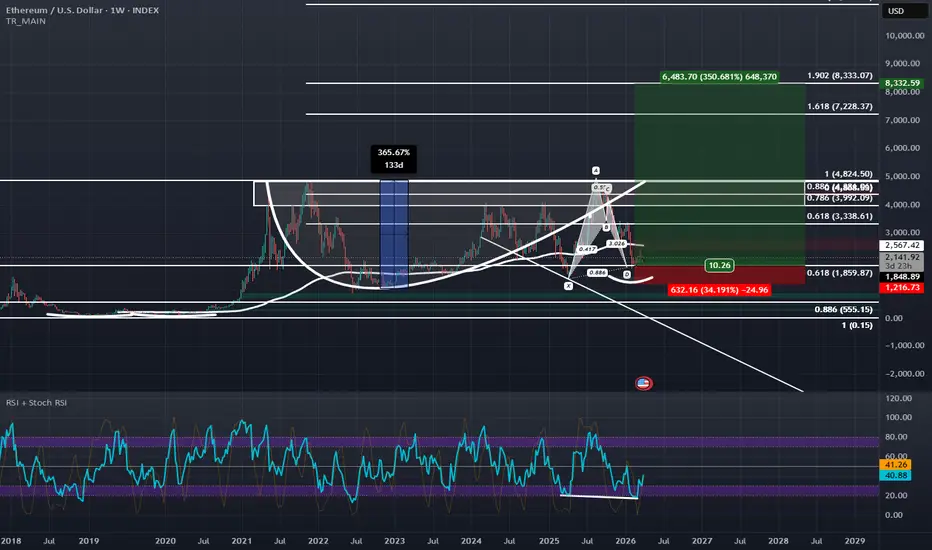
It would seem that ETH also has a big bullish setup on the weekly as seen in the current chart. We are at the all-time 0.618 Retrace and at this retrace we are making a local 0.886 and completing a Bullish Bat visible on the Weekly with Hidden Bullish Divergence on the RSI. If ETH really starts to bounce here at this heavy level of confluence it would be confirming a Partial-Decline of a Right-angled and Descending Broadening Formation, (a pattern of which that seems to be serving a secondary purpose of being the potential handle of a bigger Cup with Handle Pattern). If this starts to trade back towards 5000, chances of a Breakout are increased due to the partial decline, and the measured move of the Cup with handle and the Right-angled and Descending Broadening Formation both would take ETH to the 1.618-1.902 Fibonacci extension zones between $7,000, and $8,500.
It's also worth noting that ETHBTC on higher timeframes has also completed a Bullish Bat pattern and if you inflation adjust ETH's current price using the older metrics of the M1 Money supply before the rule change in 2020, ETH's price right now would actually be around $770 in terms of 2018 dollar value which is pretty cheap. So I'd say now would be as good of chance as any for ETH to stage a bottoming rally and this rally would likely be in line with the bottoming fractal we see on BTC: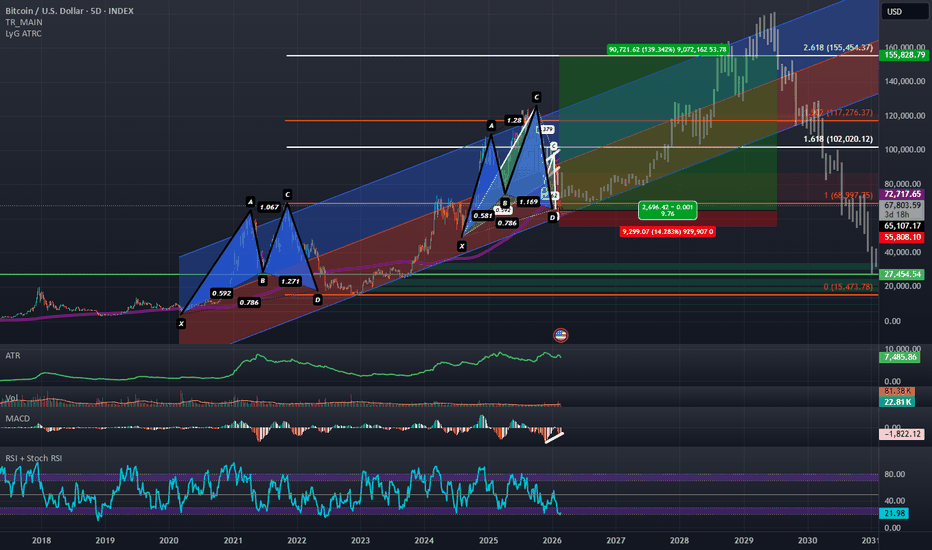
and the topping pattern we see on USDT Dominance: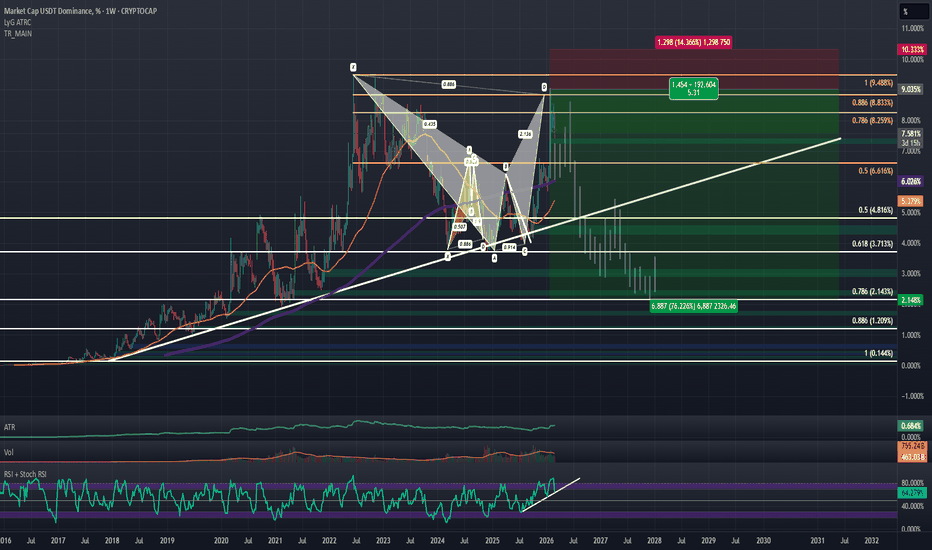
and this Bullish idea on the daily:
It would seem that ETH also has a big bullish setup on the weekly as seen in the current chart. We are at the all-time 0.618 Retrace and at this retrace we are making a local 0.886 and completing a Bullish Bat visible on the Weekly with Hidden Bullish Divergence on the RSI. If ETH really starts to bounce here at this heavy level of confluence it would be confirming a Partial-Decline of a Right-angled and Descending Broadening Formation, (a pattern of which that seems to be serving a secondary purpose of being the potential handle of a bigger Cup with Handle Pattern). If this starts to trade back towards 5000, chances of a Breakout are increased due to the partial decline, and the measured move of the Cup with handle and the Right-angled and Descending Broadening Formation both would take ETH to the 1.618-1.902 Fibonacci extension zones between $7,000, and $8,500.
It's also worth noting that ETHBTC on higher timeframes has also completed a Bullish Bat pattern and if you inflation adjust ETH's current price using the older metrics of the M1 Money supply before the rule change in 2020, ETH's price right now would actually be around $770 in terms of 2018 dollar value which is pretty cheap. So I'd say now would be as good of chance as any for ETH to stage a bottoming rally and this rally would likely be in line with the bottoming fractal we see on BTC:
and the topping pattern we see on USDT Dominance:
Сделка активна
The true inflation adjusted price of ETH is $694 in November 2018 terms.This is using the metrics that M1 used to use before the Fed 2020 rule change that allowed the inclusion of savings account deposits. (FRED:CURRSL+FRED:DEMDEPSL) This spread is on the chart here denoted by the orange line at 9.18 trillion and rising.

Похожие публикации
Отказ от ответственности
Информация и публикации не предназначены для предоставления и не являются финансовыми, инвестиционными, торговыми или другими видами советов или рекомендаций, предоставленных или одобренных TradingView. Подробнее читайте в Условиях использования.
Похожие публикации
Отказ от ответственности
Информация и публикации не предназначены для предоставления и не являются финансовыми, инвестиционными, торговыми или другими видами советов или рекомендаций, предоставленных или одобренных TradingView. Подробнее читайте в Условиях использования.