
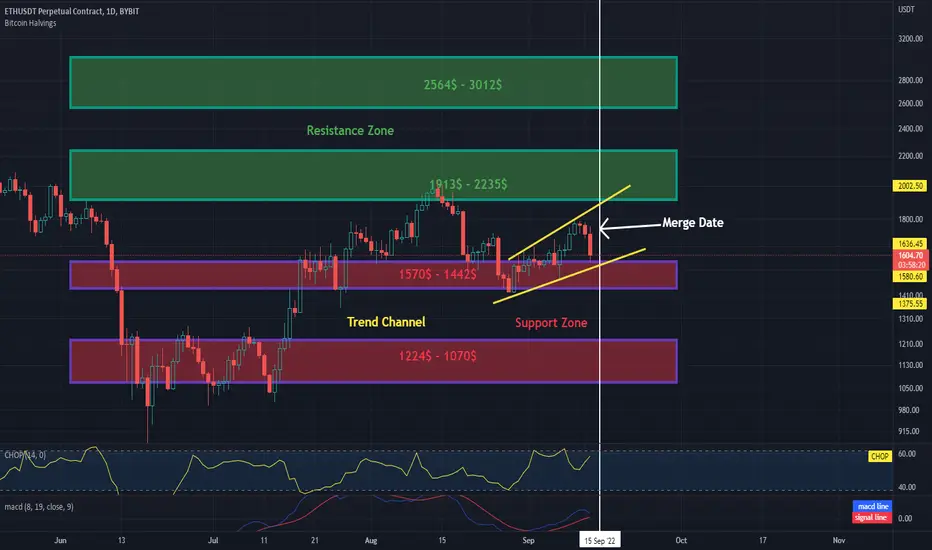
Hello everyone, let's take a look at the ETH to USDT 1 day chart as we can see price movements in the uptrend marked with yellow lines.
It is worth designating two support zones that the price has in case of a correction, and as you can see, the first zone is $ 1,570 to $ 1,442, but if the next zone breaks, the next zone is $ 1,224 to $ 1,442.
Now let's move on to the resistance that ETH has in front of it. In this case, we can also designate two zones, the first of which is in the range from $ 1913 to $ 2235, while the second is in the range of $ 2564 - $ 3012.
Pay attention to the CHOP indicator which shows that we still have a lot of energy for the next 1 day price move and the MACD indicator shows that we have not entered a downtrend yet.
It is worth designating two support zones that the price has in case of a correction, and as you can see, the first zone is $ 1,570 to $ 1,442, but if the next zone breaks, the next zone is $ 1,224 to $ 1,442.
Now let's move on to the resistance that ETH has in front of it. In this case, we can also designate two zones, the first of which is in the range from $ 1913 to $ 2235, while the second is in the range of $ 2564 - $ 3012.
Pay attention to the CHOP indicator which shows that we still have a lot of energy for the next 1 day price move and the MACD indicator shows that we have not entered a downtrend yet.

Отказ от ответственности
Информация и публикации не предназначены для предоставления и не являются финансовыми, инвестиционными, торговыми или другими видами советов или рекомендаций, предоставленных или одобренных TradingView. Подробнее читайте в Условиях использования.
Отказ от ответственности
Информация и публикации не предназначены для предоставления и не являются финансовыми, инвестиционными, торговыми или другими видами советов или рекомендаций, предоставленных или одобренных TradingView. Подробнее читайте в Условиях использования.