
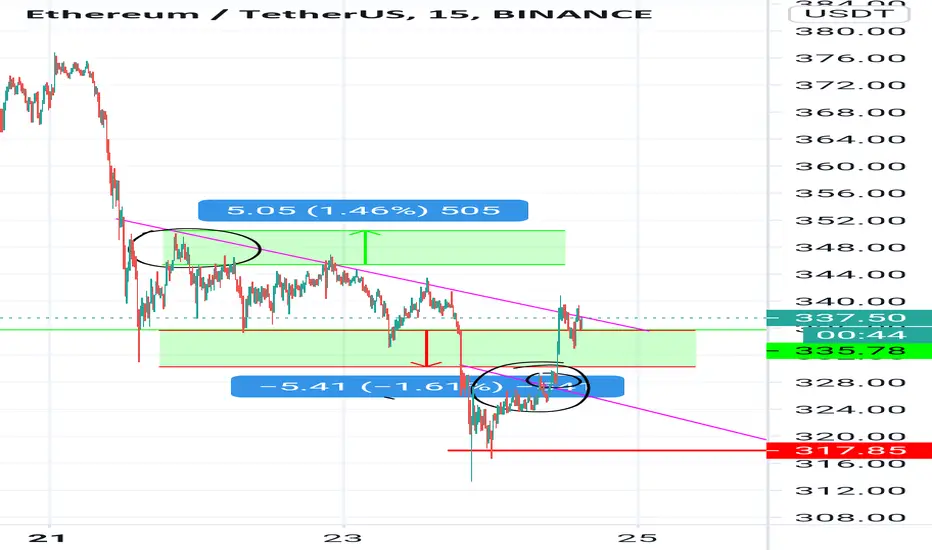
In the graph I have rounded two points..the curves look similar but difference between two moves are..the above curve retested the resistance level..but it took downward path..
The below curve why it exploded up? The reason is after retest near the resistance it consolidated near the resistance that's a indicator of a bullish move..the inner circle below circled one is the consolidated area
The below curve why it exploded up? The reason is after retest near the resistance it consolidated near the resistance that's a indicator of a bullish move..the inner circle below circled one is the consolidated area
Сделка закрыта: достигнута тейк-профит цена
If u guys watch the move in 5m time frame it would be a better clarity
Отказ от ответственности
Информация и публикации не предназначены для предоставления и не являются финансовыми, инвестиционными, торговыми или другими видами советов или рекомендаций, предоставленных или одобренных TradingView. Подробнее читайте в Условиях использования.
Отказ от ответственности
Информация и публикации не предназначены для предоставления и не являются финансовыми, инвестиционными, торговыми или другими видами советов или рекомендаций, предоставленных или одобренных TradingView. Подробнее читайте в Условиях использования.