

Monthly:
Price is currently at a key monthly level formed in July 2009, where a strong reversal previously occurred. However, this level is very old, and there has been no recent price reaction. Because of the lack of fresh confirmation, it is uncertain whether price will react again at this level. Therefore, we move to the lower timeframe (weekly) to look for any signs of reaction.
Weekly:
Price formed a false breakout above the monthly level, indicating a lack of buyers. After that, price created a lower low, followed by a lower high and another lower low, confirming a trend change from an uptrend to a downtrend. A trendline break further supports the bearish trend.
Daily :
Downtrend Confirmation:
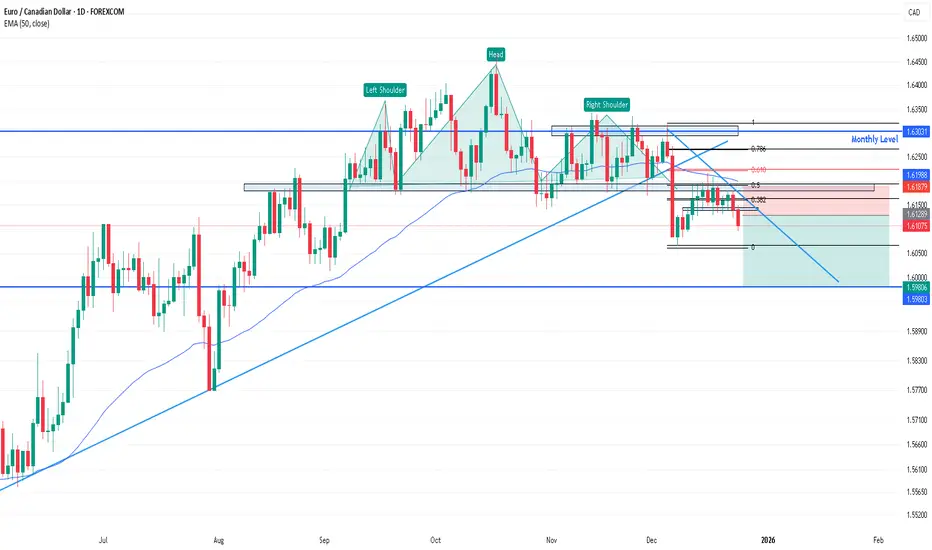
Price formed a head and shoulders pattern, along with a triple top on the right shoulder. The neckline break, confirmed by a strong bearish momentum candle, validates the continuation of the downtrend.
Pullback Zone:
Price pulled back to the neckline area, aligning with the Fibonacci 0.5–0.618 retracement zone , 50 EMA , and showing multiple candle reactions.
Entry Consideration:
Due to strong bearish momentum on the daily timeframe, entering immediately was not ideal because the stop loss would be too far. The best approach was to wait for a pullback and confirm its completion on the 4-hour timeframe.
4-Hour Timeframe:
Price formed a channel pattern during the pullback. A break of the channel, followed by a lower low, confirmed that the pullback was complete and the downtrend was likely to continue, providing a valid trade entry.
Price is currently at a key monthly level formed in July 2009, where a strong reversal previously occurred. However, this level is very old, and there has been no recent price reaction. Because of the lack of fresh confirmation, it is uncertain whether price will react again at this level. Therefore, we move to the lower timeframe (weekly) to look for any signs of reaction.
Weekly:
Price formed a false breakout above the monthly level, indicating a lack of buyers. After that, price created a lower low, followed by a lower high and another lower low, confirming a trend change from an uptrend to a downtrend. A trendline break further supports the bearish trend.
Daily :
Downtrend Confirmation:
Price formed a head and shoulders pattern, along with a triple top on the right shoulder. The neckline break, confirmed by a strong bearish momentum candle, validates the continuation of the downtrend.
Pullback Zone:
Price pulled back to the neckline area, aligning with the Fibonacci 0.5–0.618 retracement zone , 50 EMA , and showing multiple candle reactions.
Entry Consideration:
Due to strong bearish momentum on the daily timeframe, entering immediately was not ideal because the stop loss would be too far. The best approach was to wait for a pullback and confirm its completion on the 4-hour timeframe.
4-Hour Timeframe:
Price formed a channel pattern during the pullback. A break of the channel, followed by a lower low, confirmed that the pullback was complete and the downtrend was likely to continue, providing a valid trade entry.
Сделка активна
Guys, we haven’t used any indicators. This is purely price action analysis—what are your thoughts?Сделка закрыта вручную
Price has started consolidating between 1.60828 and 1.60929, while the correlated pair GBPCAD is moving upward. The trade was manually closed with a small profit.
Отказ от ответственности
Информация и публикации не предназначены для предоставления и не являются финансовыми, инвестиционными, торговыми или другими видами советов или рекомендаций, предоставленных или одобренных TradingView. Подробнее читайте в Условиях использования.
Отказ от ответственности
Информация и публикации не предназначены для предоставления и не являются финансовыми, инвестиционными, торговыми или другими видами советов или рекомендаций, предоставленных или одобренных TradingView. Подробнее читайте в Условиях использования.