

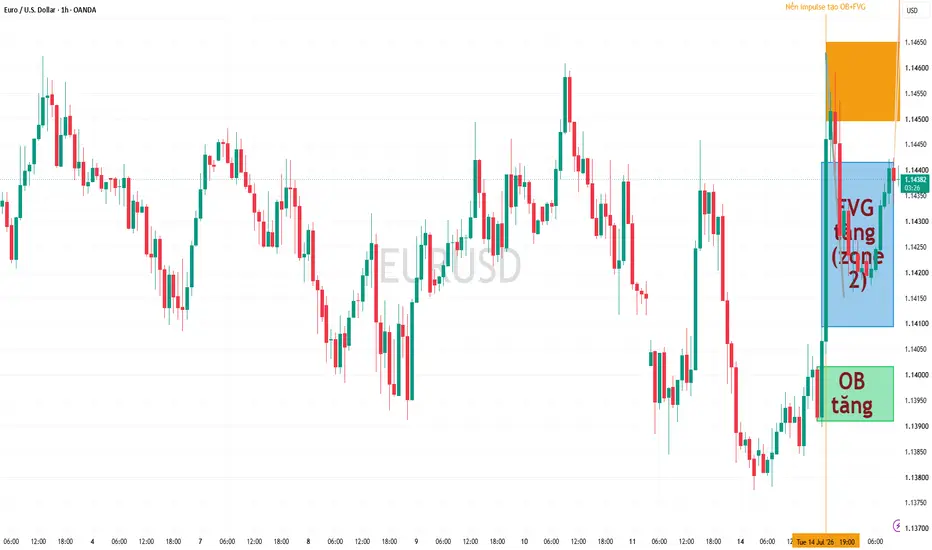
This is kieu_le's strategy. The AI read and understood kieu_le's strategy and marked it up automatically on the chart.
Strategy
Find bullish/bearish OB on M30 and H3 timeframes, then mark that zone and wait for price to touch the OB zone. Example: if it's a bullish OB on M30, drop to M1 timeframe and look for a candlestick pattern where "the prior candle's high is lower than the next candle's close" — mark this as zone 1. Continue looking for a bullish FVG — mark this as zone 2. Wait for price to return and retest zone 1 or zone 2 while simultaneously forming the same candlestick pattern (prior candle's high lower than next candle's close), then enter the trade with stop-loss placed 10 pips below the prior candle. Do the reverse for a bearish OB. If price touches the OB on the H3 timeframe, drop to the M5 timeframe and look for the same pattern.
Analysis
Applied the strategy's process, but the data provided is only H1 (used as a proxy for M30/H3) with no M1/M5 data available, so the final entry-trigger step cannot be verified — hence neutral rather than guessing.
Step 1 - Find OB on higher TF (H1 as M30/H3 proxy): On 2026-07-14 12:00 a very strong bullish candle appears (open 1.14066 → high 1.14628 → close 1.14460, volume 22670, far above average) breaking the prior 1.1390-1.1410 range. The last bearish candle before this impulse is the 10:00 candle (open 1.14010, high 1.14016, low 1.13910, close 1.13918) → this is the bullish OB, zone 1.13910–1.14016.
Step 2 - Find the accompanying bullish FVG: comparing candles 11:00→12:00→13:00, the 11:00 high (1.14094) is below the 13:00 low (1.14415) → creating a bullish FVG gap of 1.14094–1.14415, sitting just above the OB.
Step 3 - Wait for price to retest zone 1 (OB) or 2 (FVG): After the impulse, price peaked at 1.14628, then pulled back to 1.14152-1.14162 (07-14 20:00-21:00), then recovered to 1.14403 (currently 1.1438). So price has only retested the lower part of the FVG (around 1.1415-1.1420) but not the full FVG, and has NOT touched the bullish OB zone (1.13910–1.14016) at all.
Step 4 - Entry confirmation: per the strategy, once price touches zone 1 or 2, drop to M1 (for M30 OB) or M5 (for H3 OB) to find the "prior candle's high lower than the next candle's close" momentum pattern, then enter with SL 10 pips below the prior candle. No M1/M5 data is available, so this final trigger condition cannot be confirmed even though price is approaching the FVG zone.
=> Conclusion: The bullish OB + FVG setup is clearly formed and price is approaching the zone of interest, but (a) price hasn't fully tagged the OB yet, and (b) M1/M5 data needed to confirm the trigger candle and precise SL is missing. Therefore bias = neutral, waiting for price to reach deeper into the OB zone (1.13910-1.14016) or the upper FVG before checking the lower timeframe.
Not financial advice.
Strategy
Find bullish/bearish OB on M30 and H3 timeframes, then mark that zone and wait for price to touch the OB zone. Example: if it's a bullish OB on M30, drop to M1 timeframe and look for a candlestick pattern where "the prior candle's high is lower than the next candle's close" — mark this as zone 1. Continue looking for a bullish FVG — mark this as zone 2. Wait for price to return and retest zone 1 or zone 2 while simultaneously forming the same candlestick pattern (prior candle's high lower than next candle's close), then enter the trade with stop-loss placed 10 pips below the prior candle. Do the reverse for a bearish OB. If price touches the OB on the H3 timeframe, drop to the M5 timeframe and look for the same pattern.
Analysis
Applied the strategy's process, but the data provided is only H1 (used as a proxy for M30/H3) with no M1/M5 data available, so the final entry-trigger step cannot be verified — hence neutral rather than guessing.
Step 1 - Find OB on higher TF (H1 as M30/H3 proxy): On 2026-07-14 12:00 a very strong bullish candle appears (open 1.14066 → high 1.14628 → close 1.14460, volume 22670, far above average) breaking the prior 1.1390-1.1410 range. The last bearish candle before this impulse is the 10:00 candle (open 1.14010, high 1.14016, low 1.13910, close 1.13918) → this is the bullish OB, zone 1.13910–1.14016.
Step 2 - Find the accompanying bullish FVG: comparing candles 11:00→12:00→13:00, the 11:00 high (1.14094) is below the 13:00 low (1.14415) → creating a bullish FVG gap of 1.14094–1.14415, sitting just above the OB.
Step 3 - Wait for price to retest zone 1 (OB) or 2 (FVG): After the impulse, price peaked at 1.14628, then pulled back to 1.14152-1.14162 (07-14 20:00-21:00), then recovered to 1.14403 (currently 1.1438). So price has only retested the lower part of the FVG (around 1.1415-1.1420) but not the full FVG, and has NOT touched the bullish OB zone (1.13910–1.14016) at all.
Step 4 - Entry confirmation: per the strategy, once price touches zone 1 or 2, drop to M1 (for M30 OB) or M5 (for H3 OB) to find the "prior candle's high lower than the next candle's close" momentum pattern, then enter with SL 10 pips below the prior candle. No M1/M5 data is available, so this final trigger condition cannot be confirmed even though price is approaching the FVG zone.
=> Conclusion: The bullish OB + FVG setup is clearly formed and price is approaching the zone of interest, but (a) price hasn't fully tagged the OB yet, and (b) M1/M5 data needed to confirm the trigger candle and precise SL is missing. Therefore bias = neutral, waiting for price to reach deeper into the OB zone (1.13910-1.14016) or the upper FVG before checking the lower timeframe.
Not financial advice.

Our Custom Programming Service: Focusing on Pine Script to develop indicators/Bots on TradingView/MT5 that support traders in the Forex, Stock, and Crypto markets
facebook.com/groups/1128766605090440/
facebook.com/groups/1128766605090440/
Отказ от ответственности
Информация и публикации не предназначены для предоставления и не являются финансовыми, инвестиционными, торговыми или другими видами советов или рекомендаций, предоставленных или одобренных TradingView. Подробнее читайте в Условиях использования.
Our Custom Programming Service: Focusing on Pine Script to develop indicators/Bots on TradingView/MT5 that support traders in the Forex, Stock, and Crypto markets
facebook.com/groups/1128766605090440/
facebook.com/groups/1128766605090440/
Отказ от ответственности
Информация и публикации не предназначены для предоставления и не являются финансовыми, инвестиционными, торговыми или другими видами советов или рекомендаций, предоставленных или одобренных TradingView. Подробнее читайте в Условиях использования.