
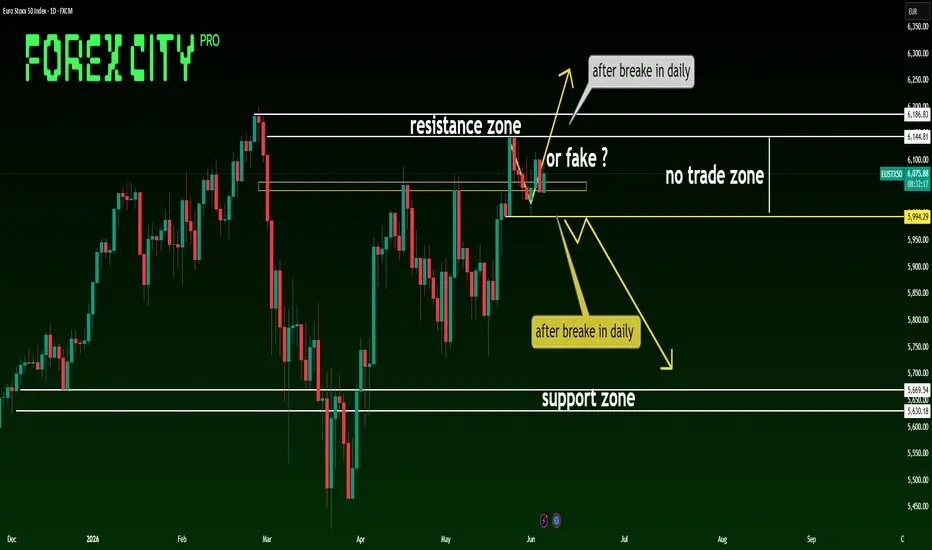
📈 Euro Stoxx 50 Analysis | Daily & 4H Timeframes
Hello TradingView traders and investors! 👋📊
I hope you're having a profitable trading week. Today we're taking a look at the Euro Stoxx 50 Index (EUSTX50), one of the most important equity indices in Europe, representing some of the largest and most influential companies across the Eurozone. 🇪🇺💼
As a benchmark for European market sentiment, the index often provides valuable insight into institutional capital flows, economic expectations, and overall risk appetite in global markets.
🌍 Market Overview
The broader market structure remains bullish on higher timeframes. 📈
Despite recent consolidation, buyers continue to maintain control of the long-term trend, and the overall structure still favors upside continuation unless key support levels are broken.
However, as traders, we must separate the long-term trend from the current short-term trading environment. 🎯
📊 Technical Analysis
🚀 Higher Timeframe Trend
Looking at the daily and higher timeframes, the market continues to print a bullish structure with higher highs and higher lows.
✅ Long-term trend remains bullish
✅ Buyers are still defending major support areas
✅ No significant bearish structure has formed yet
⚠️ 4H Breakout – Real Move or Fakeout?
On the 4-hour timeframe, price has recently pushed above the local range high and resistance area. 📦➡️📈
While this breakout is technically bullish, traders should remain cautious because:
🔸 The breakout has occurred directly beneath a major daily resistance zone.
🔸 False breakouts are common around key liquidity areas.
🔸 Price still needs confirmation before a sustainable trend continuation can be expected.
At this stage, the breakout remains promising, but the possibility of a fake move should not be ignored. ⚠️
🚫 Daily "No Trade Zone"
One of the most important observations on the chart is the current location of price.
📍 Price is trading inside a major daily decision area — a zone where neither buyers nor sellers currently have a clear advantage.
For this reason, the highlighted area can be considered a No Trade Zone until a confirmed directional breakout occurs.
Patience is often the highest-probability trade. ⏳
🟢 Bullish Scenario
If buyers manage to achieve a confirmed daily breakout above the resistance zone:
✅ Bullish momentum could accelerate
✅ Institutional buying may increase
✅ A new long-term expansion phase could begin
In this case, the market would likely target higher resistance levels and continue the broader bullish trend. 🚀📈
🔴 Bearish Scenario
If price fails to hold above the current area and breaks the No Trade Zone to the downside on the daily timeframe:
✅ Sellers could regain control
✅ Momentum may shift toward lower support levels
✅ Short opportunities would become technically attractive
A confirmed daily breakdown would be the first meaningful warning sign against the current bullish structure. 📉
⚖️ Current Market Bias
At the moment, I view the bullish and bearish scenarios as equally probable.
📊 Bullish Weight: 50%
📊 Bearish Weight: 50%
The market is currently positioned at a key decision point, and confirmation will be required before committing to a directional bias.
For now, patience and risk management remain the priority. 🎯
🗳️ Community Poll
What do you expect next for the Euro Stoxx 50?
🔘 Daily breakout and continuation higher 🚀
🔘 Fake breakout and move lower 📉
🔘 Continued consolidation inside the current zone 📦
Share your opinion in the comments below! 👇
⚠️ Disclaimer
This analysis reflects my personal interpretation of market structure and price action and is provided for educational purposes only. It should not be considered financial advice. Always conduct your own research, follow proper risk management rules, and never invest more than you can afford to lose.
🏷️ Tags
#EUSTX50 #EuroStoxx50 #EuropeanMarkets #StockMarket #Indices #PriceAction #TechnicalAnalysis #TradingView #SwingTrading #DayTrading #MarketStructure #SupportAndResistance #BreakoutTrading #RiskManagement #Investing #GlobalMarkets #Bullish #Bearish #MarketAnalysis #ForexCity 📈🇪🇺🚀📉
Hello TradingView traders and investors! 👋📊
I hope you're having a profitable trading week. Today we're taking a look at the Euro Stoxx 50 Index (EUSTX50), one of the most important equity indices in Europe, representing some of the largest and most influential companies across the Eurozone. 🇪🇺💼
As a benchmark for European market sentiment, the index often provides valuable insight into institutional capital flows, economic expectations, and overall risk appetite in global markets.
🌍 Market Overview
The broader market structure remains bullish on higher timeframes. 📈
Despite recent consolidation, buyers continue to maintain control of the long-term trend, and the overall structure still favors upside continuation unless key support levels are broken.
However, as traders, we must separate the long-term trend from the current short-term trading environment. 🎯
📊 Technical Analysis
🚀 Higher Timeframe Trend
Looking at the daily and higher timeframes, the market continues to print a bullish structure with higher highs and higher lows.
✅ Long-term trend remains bullish
✅ Buyers are still defending major support areas
✅ No significant bearish structure has formed yet
⚠️ 4H Breakout – Real Move or Fakeout?
On the 4-hour timeframe, price has recently pushed above the local range high and resistance area. 📦➡️📈
While this breakout is technically bullish, traders should remain cautious because:
🔸 The breakout has occurred directly beneath a major daily resistance zone.
🔸 False breakouts are common around key liquidity areas.
🔸 Price still needs confirmation before a sustainable trend continuation can be expected.
At this stage, the breakout remains promising, but the possibility of a fake move should not be ignored. ⚠️
🚫 Daily "No Trade Zone"
One of the most important observations on the chart is the current location of price.
📍 Price is trading inside a major daily decision area — a zone where neither buyers nor sellers currently have a clear advantage.
For this reason, the highlighted area can be considered a No Trade Zone until a confirmed directional breakout occurs.
Patience is often the highest-probability trade. ⏳
🟢 Bullish Scenario
If buyers manage to achieve a confirmed daily breakout above the resistance zone:
✅ Bullish momentum could accelerate
✅ Institutional buying may increase
✅ A new long-term expansion phase could begin
In this case, the market would likely target higher resistance levels and continue the broader bullish trend. 🚀📈
🔴 Bearish Scenario
If price fails to hold above the current area and breaks the No Trade Zone to the downside on the daily timeframe:
✅ Sellers could regain control
✅ Momentum may shift toward lower support levels
✅ Short opportunities would become technically attractive
A confirmed daily breakdown would be the first meaningful warning sign against the current bullish structure. 📉
⚖️ Current Market Bias
At the moment, I view the bullish and bearish scenarios as equally probable.
📊 Bullish Weight: 50%
📊 Bearish Weight: 50%
The market is currently positioned at a key decision point, and confirmation will be required before committing to a directional bias.
For now, patience and risk management remain the priority. 🎯
🗳️ Community Poll
What do you expect next for the Euro Stoxx 50?
🔘 Daily breakout and continuation higher 🚀
🔘 Fake breakout and move lower 📉
🔘 Continued consolidation inside the current zone 📦
Share your opinion in the comments below! 👇
⚠️ Disclaimer
This analysis reflects my personal interpretation of market structure and price action and is provided for educational purposes only. It should not be considered financial advice. Always conduct your own research, follow proper risk management rules, and never invest more than you can afford to lose.
🏷️ Tags
#EUSTX50 #EuroStoxx50 #EuropeanMarkets #StockMarket #Indices #PriceAction #TechnicalAnalysis #TradingView #SwingTrading #DayTrading #MarketStructure #SupportAndResistance #BreakoutTrading #RiskManagement #Investing #GlobalMarkets #Bullish #Bearish #MarketAnalysis #ForexCity 📈🇪🇺🚀📉

Отказ от ответственности
Информация и публикации не предназначены для предоставления и не являются финансовыми, инвестиционными, торговыми или другими видами советов или рекомендаций, предоставленных или одобренных TradingView. Подробнее читайте в Условиях использования.
Отказ от ответственности
Информация и публикации не предназначены для предоставления и не являются финансовыми, инвестиционными, торговыми или другими видами советов или рекомендаций, предоставленных или одобренных TradingView. Подробнее читайте в Условиях использования.