full disclosure: I'm long the Dec19'14 puts @ $50
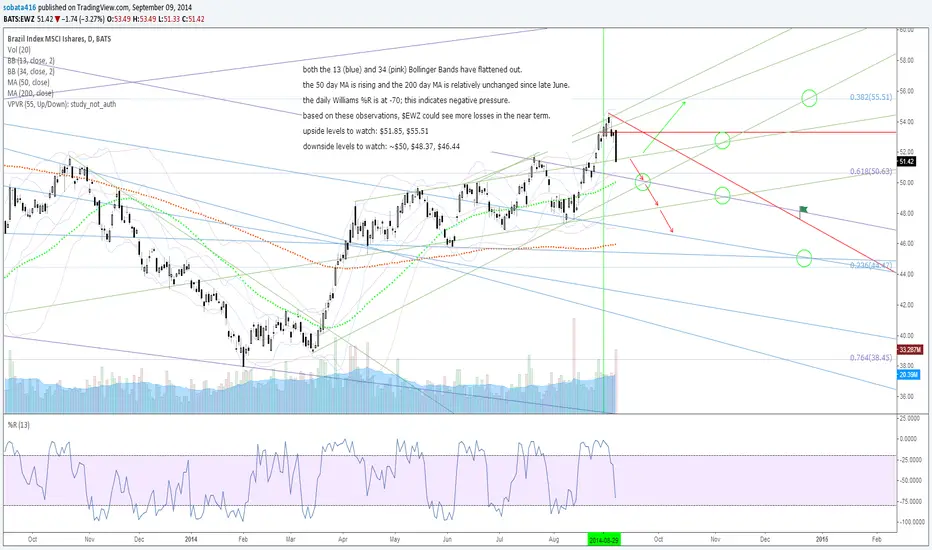
both the 13 (blue) and 34 (pink) Bollinger Bands have flattened out.
the 50 day MA is rising and the 200 day MA is relatively unchanged since late June.
the daily Williams %R is at -70; this indicates that pressure might turn negative.
based on these observations, EWZ could see more losses in the near term.
upside levels to watch: $51.85, $55.51
downside levels to watch: ~$50, $48.37, $46.44
both the 13 (blue) and 34 (pink) Bollinger Bands have flattened out.
the 50 day MA is rising and the 200 day MA is relatively unchanged since late June.
the daily Williams %R is at -70; this indicates that pressure might turn negative.
based on these observations,
EWZ could see more losses in the near term.upside levels to watch: $51.85, $55.51
downside levels to watch: ~$50, $48.37, $46.44

Отказ от ответственности
Информация и публикации не предназначены для предоставления и не являются финансовыми, инвестиционными, торговыми или другими видами советов или рекомендаций, предоставленных или одобренных TradingView. Подробнее читайте в Условиях использования.
Отказ от ответственности
Информация и публикации не предназначены для предоставления и не являются финансовыми, инвестиционными, торговыми или другими видами советов или рекомендаций, предоставленных или одобренных TradingView. Подробнее читайте в Условиях использования.