
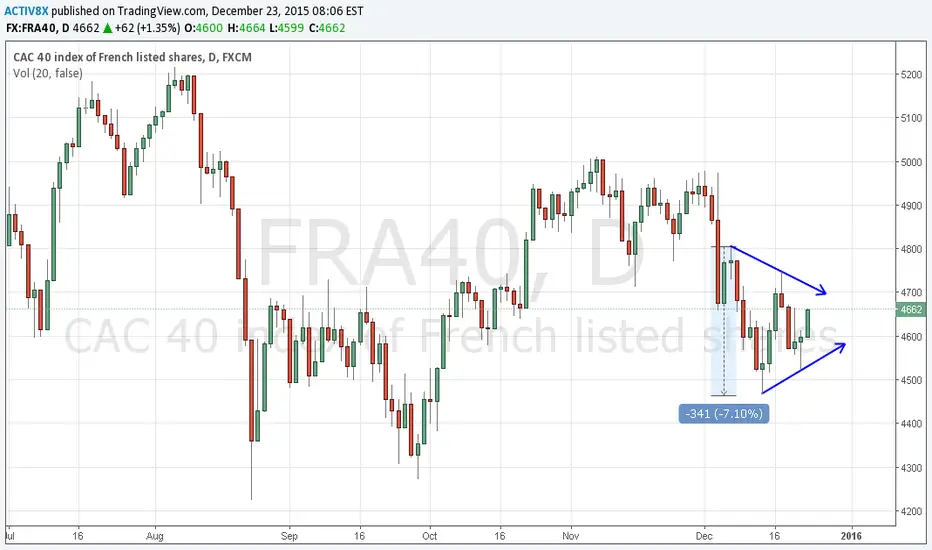
After a rough bearish market on FRA40, prices are consolidating in a triangle that can be seen on the chart. Since it is a symmetrical triangle, prices can go either way:
- Fra40 would rally 170 points, should it breakout the higher edge of the triangle.
- Fra40 would go south 170 points, should it breakout the lower edge of the triangle.
The daily Pivot Point is around 4579.33. The daily support levels are around 4543.66 and 4487.33. The daily resistance levels are around 4635.66 and 4671.33.
- Fra40 would rally 170 points, should it breakout the higher edge of the triangle.
- Fra40 would go south 170 points, should it breakout the lower edge of the triangle.
The daily Pivot Point is around 4579.33. The daily support levels are around 4543.66 and 4487.33. The daily resistance levels are around 4635.66 and 4671.33.

Отказ от ответственности
Информация и публикации не предназначены для предоставления и не являются финансовыми, инвестиционными, торговыми или другими видами советов или рекомендаций, предоставленных или одобренных TradingView. Подробнее читайте в Условиях использования.
Отказ от ответственности
Информация и публикации не предназначены для предоставления и не являются финансовыми, инвестиционными, торговыми или другими видами советов или рекомендаций, предоставленных или одобренных TradingView. Подробнее читайте в Условиях использования.