FTM retested breakout
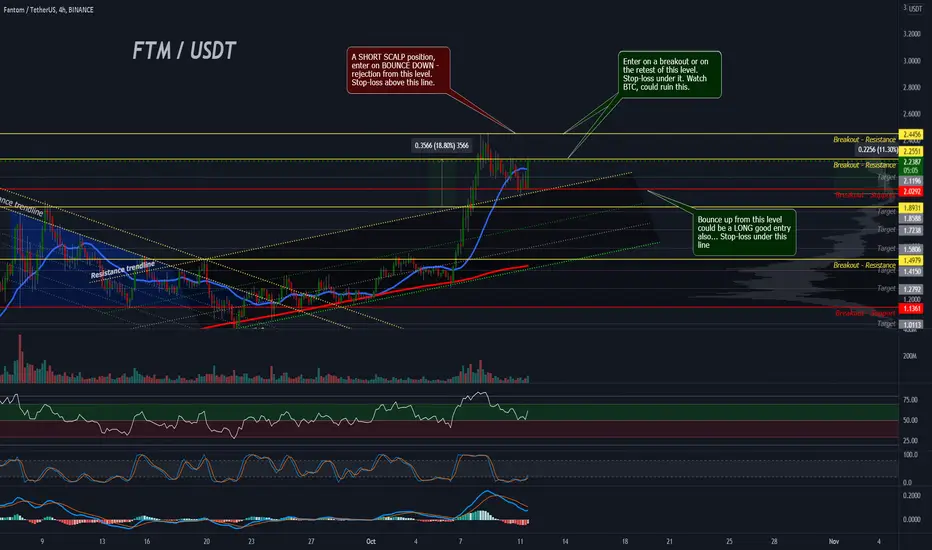
Looks like a successful retest of a breakout from this big ascending channel, and that's a very bullish sign. If you entered on my last FTM chart, now about 18% in profit so far. (link to it is below) Now under a small resistance level and we could see a small pullback (indicators on 1hr are relatively high, have more room for going up, so this pullback could happen also after we break up from this resistance level). Indicators on 4hr look bullish and could see the golden cross on MACD if the price continues up. I would really like this candle to close above 20sma (blue line) for further upside.
One concern that I have is that if price go up more and indicators do not climb above the previous high levels, we might end up with multiple bear div-s. So we must keep an eye on this...
Good luck traders
One concern that I have is that if price go up more and indicators do not climb above the previous high levels, we might end up with multiple bear div-s. So we must keep an eye on this...
Good luck traders

Похожие публикации
Отказ от ответственности
Информация и публикации не предназначены для предоставления и не являются финансовыми, инвестиционными, торговыми или другими видами советов или рекомендаций, предоставленных или одобренных TradingView. Подробнее читайте в Условиях использования.
Похожие публикации
Отказ от ответственности
Информация и публикации не предназначены для предоставления и не являются финансовыми, инвестиционными, торговыми или другими видами советов или рекомендаций, предоставленных или одобренных TradingView. Подробнее читайте в Условиях использования.