
#FTX
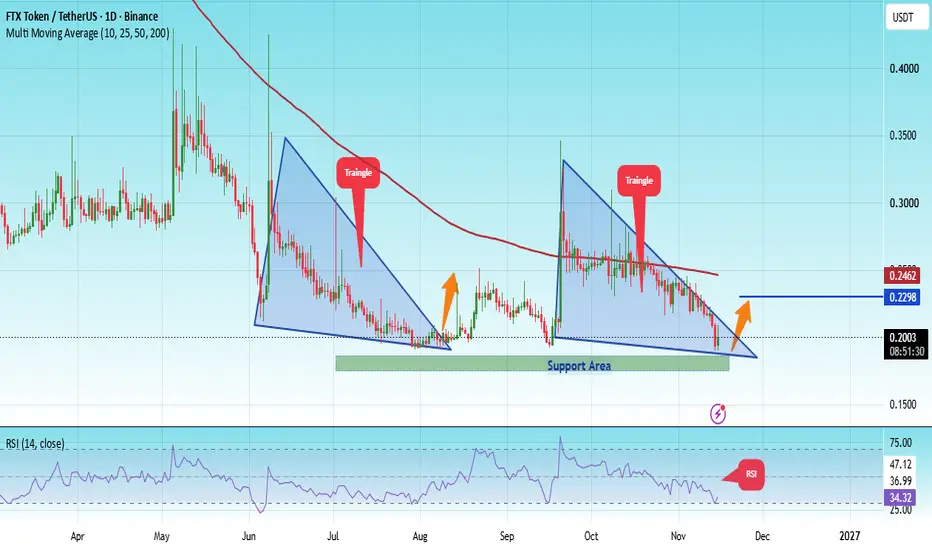
On the daily timeframe, FTT is moving within a well-defined triangle pattern, reflecting a period of price consolidation ahead of a potential directional breakout.
Back in August, the token experienced a strong bullish rally following a successful breakout above the triangle pattern, highlighting the technical significance of this formation in shaping its price movements.
Looking at the current price action, FTT is relying on a major support zone highlighted in green around $0.1750. This level has demonstrated its importance by supporting the price and limiting further selling pressure, potentially serving as a launching point for another bullish rebound.
If the price manages to hold above the current support zone and attract sufficient buying pressure, a new upward move could develop, targeting $0.2300.
This represents an important technical target, particularly as it is located near the resistance level of the 200-day Moving Average (MA200), making it a key area to watch.
The $0.1750 level remains the critical support for this setup. A decisive break below this level, followed by a close beneath it, could invalidate the bullish scenario and significantly weaken the positive outlook.
Overall, FTT is approaching an important technical turning point, with the $0.1750 support zone playing a crucial role in determining its next move. Holding this level could pave the way for a bullish rebound toward $0.2300, where the price may encounter resistance from the 200-day Moving Average.
On the daily timeframe, FTT is moving within a well-defined triangle pattern, reflecting a period of price consolidation ahead of a potential directional breakout.
Back in August, the token experienced a strong bullish rally following a successful breakout above the triangle pattern, highlighting the technical significance of this formation in shaping its price movements.
Looking at the current price action, FTT is relying on a major support zone highlighted in green around $0.1750. This level has demonstrated its importance by supporting the price and limiting further selling pressure, potentially serving as a launching point for another bullish rebound.
If the price manages to hold above the current support zone and attract sufficient buying pressure, a new upward move could develop, targeting $0.2300.
This represents an important technical target, particularly as it is located near the resistance level of the 200-day Moving Average (MA200), making it a key area to watch.
The $0.1750 level remains the critical support for this setup. A decisive break below this level, followed by a close beneath it, could invalidate the bullish scenario and significantly weaken the positive outlook.
Overall, FTT is approaching an important technical turning point, with the $0.1750 support zone playing a crucial role in determining its next move. Holding this level could pave the way for a bullish rebound toward $0.2300, where the price may encounter resistance from the 200-day Moving Average.

Join Telegram Channel Signals Futures and Spot
👉t.me/+WN4RexVn8DM2MTlk
👉t.me/+WN4RexVn8DM2MTlk
Отказ от ответственности
Информация и публикации не предназначены для предоставления и не являются финансовыми, инвестиционными, торговыми или другими видами советов или рекомендаций, предоставленных или одобренных TradingView. Подробнее читайте в Условиях использования.
Join Telegram Channel Signals Futures and Spot
👉t.me/+WN4RexVn8DM2MTlk
👉t.me/+WN4RexVn8DM2MTlk
Отказ от ответственности
Информация и публикации не предназначены для предоставления и не являются финансовыми, инвестиционными, торговыми или другими видами советов или рекомендаций, предоставленных или одобренных TradingView. Подробнее читайте в Условиях использования.