

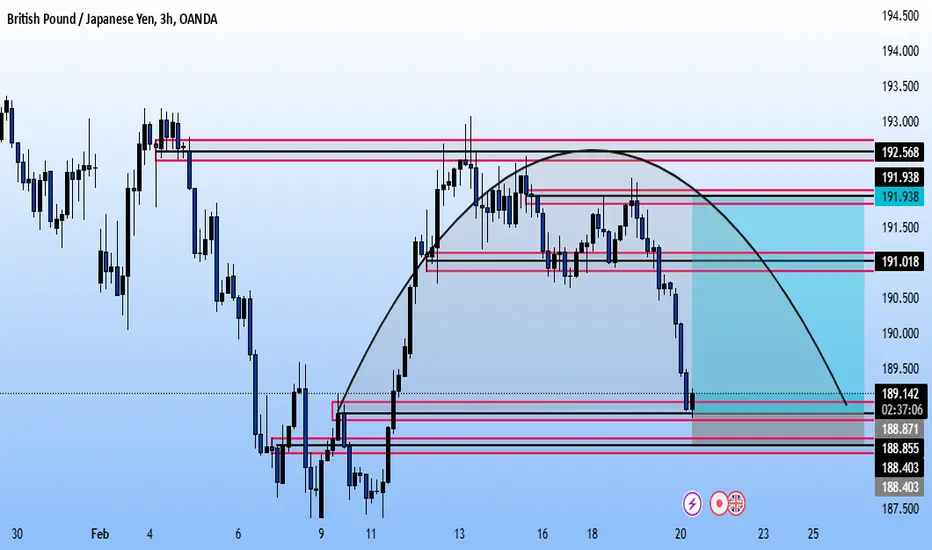
chart showing the analysis of a JPY (Japanese Yen) pair on a 3-hour timeframe. Multiple support and resistance zones are marked with red and blue horizontal lines.
Key Observations:
1. Price Movement: The price is in a downtrend and is reacting at a strong support level (around 189.142).
2. Fibonacci & Zones: The chart seems to incorporate Fibonacci retracement or supply/demand zones for analysis.
3. Indicators & Analysis: No specific indicators are visible, but the analysis appears to be based on price action and market structure.
4. Potential Trade Setup: If the price bounces from this level, a reversal may occur. Otherwise, there’s a chance of further downside continuation.
Key Observations:
1. Price Movement: The price is in a downtrend and is reacting at a strong support level (around 189.142).
2. Fibonacci & Zones: The chart seems to incorporate Fibonacci retracement or supply/demand zones for analysis.
3. Indicators & Analysis: No specific indicators are visible, but the analysis appears to be based on price action and market structure.
4. Potential Trade Setup: If the price bounces from this level, a reversal may occur. Otherwise, there’s a chance of further downside continuation.
Сделка активна
Active Trade.
Отказ от ответственности
Информация и публикации не предназначены для предоставления и не являются финансовыми, инвестиционными, торговыми или другими видами советов или рекомендаций, предоставленных или одобренных TradingView. Подробнее читайте в Условиях использования.
Отказ от ответственности
Информация и публикации не предназначены для предоставления и не являются финансовыми, инвестиционными, торговыми или другими видами советов или рекомендаций, предоставленных или одобренных TradingView. Подробнее читайте в Условиях использования.