

Visit fourrades website for more details
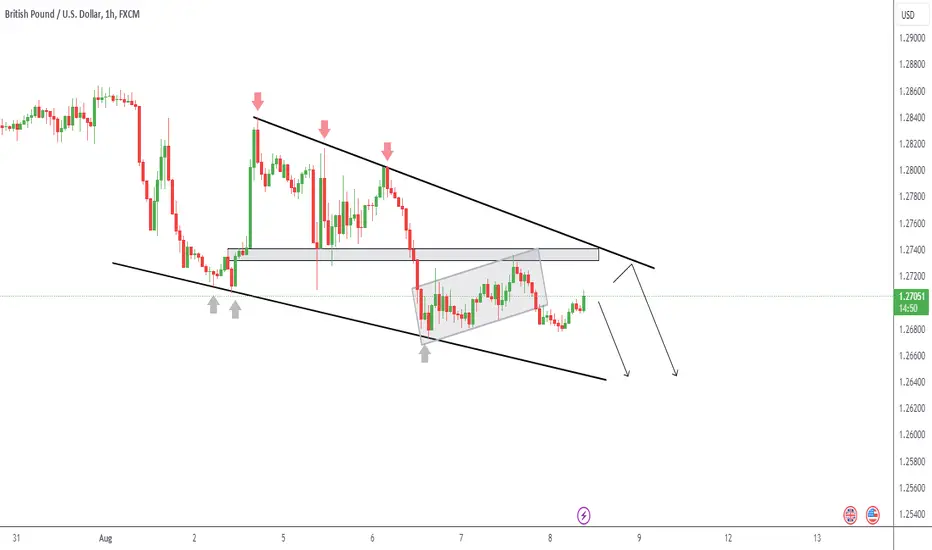
The 1-hour chart of GBP/USD shows a distinct bearish pennant pattern forming. The price has been consolidating within this structure, with lower highs and lower lows, indicating a potential continuation of the downward trend. The critical levels to watch are:
Resistance near 1.2720 (upper trendline of the pennant)
Support around 1.2660 (lower trendline of the pennant)
If the price breaks below the lower trendline, it may signal further bearish momentum. Conversely, a break above the upper trendline could indicate a potential reversal or a temporary bullish correction.
The 1-hour chart of GBP/USD shows a distinct bearish pennant pattern forming. The price has been consolidating within this structure, with lower highs and lower lows, indicating a potential continuation of the downward trend. The critical levels to watch are:
Resistance near 1.2720 (upper trendline of the pennant)
Support around 1.2660 (lower trendline of the pennant)
If the price breaks below the lower trendline, it may signal further bearish momentum. Conversely, a break above the upper trendline could indicate a potential reversal or a temporary bullish correction.

Отказ от ответственности
Информация и публикации не предназначены для предоставления и не являются финансовыми, инвестиционными, торговыми или другими видами советов или рекомендаций, предоставленных или одобренных TradingView. Подробнее читайте в Условиях использования.
Отказ от ответственности
Информация и публикации не предназначены для предоставления и не являются финансовыми, инвестиционными, торговыми или другими видами советов или рекомендаций, предоставленных или одобренных TradingView. Подробнее читайте в Условиях использования.