
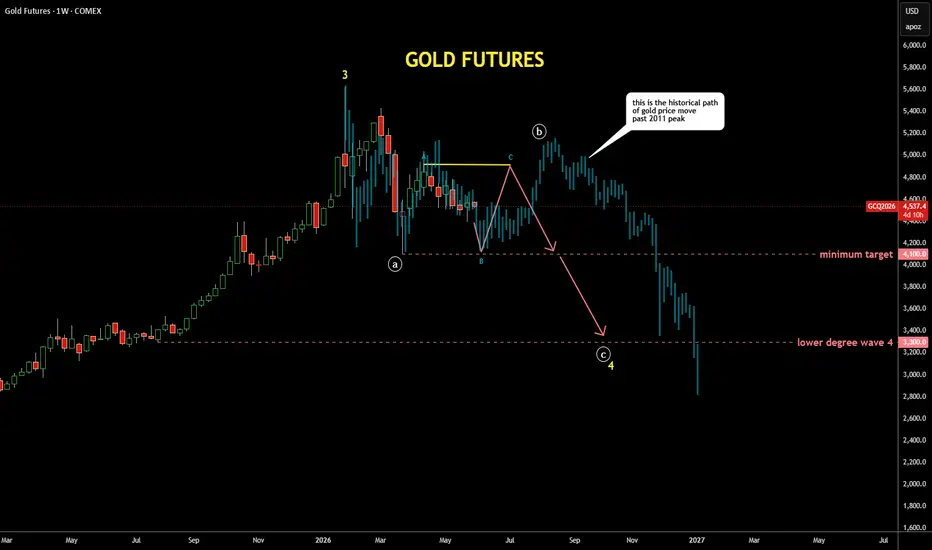
It's quite interesting exercise to check past patterns
if it is applicable to the current price structure
I scrolled back to distant 2011 where the gold peaked around $1,900,
copied the structure from there and pasted to the current peak
I fitted the bar pattern (faded blue bars) with tops and bottoms
It looks similar to the current structure as extremes align almost perfectly
It also matches with the map I posted earlier last week with bit more volatility
if it is applicable to the current price structure
I scrolled back to distant 2011 where the gold peaked around $1,900,
copied the structure from there and pasted to the current peak
I fitted the bar pattern (faded blue bars) with tops and bottoms
It looks similar to the current structure as extremes align almost perfectly
It also matches with the map I posted earlier last week with bit more volatility

Похожие публикации
Отказ от ответственности
Информация и публикации не предназначены для предоставления и не являются финансовыми, инвестиционными, торговыми или другими видами советов или рекомендаций, предоставленных или одобренных TradingView. Подробнее читайте в Условиях использования.
Похожие публикации
Отказ от ответственности
Информация и публикации не предназначены для предоставления и не являются финансовыми, инвестиционными, торговыми или другими видами советов или рекомендаций, предоставленных или одобренных TradingView. Подробнее читайте в Условиях использования.