
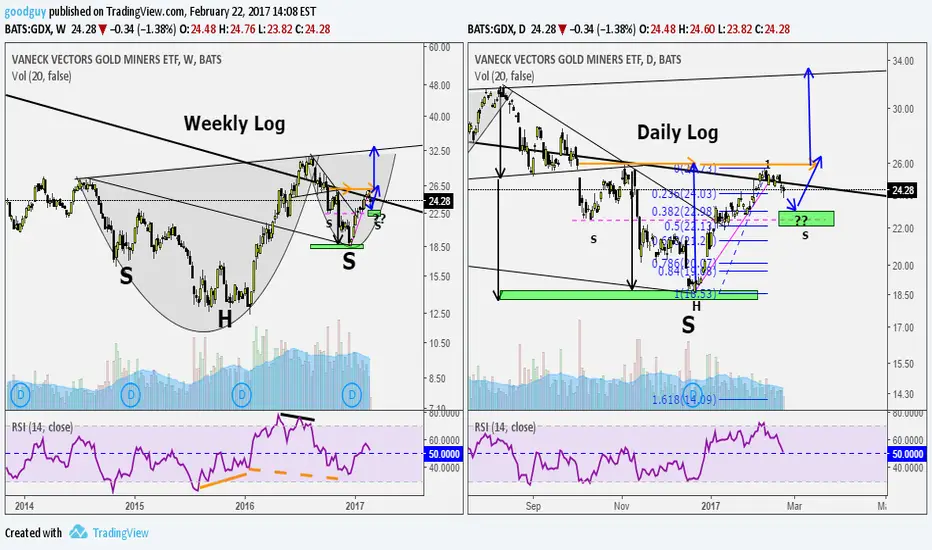
As the us dollar has been correcting up the gold miners has begun correcting down. I'm trying to get a handle on the bigger picture. On the weekly log chart it looks to me like a cup and handle or inverse H&S with the right side higher than the left which I believe is bullish. And to me it looks the handle of the cup is now forming possibly as smaller inverse H&S (see daily chart).
IF so the near term target may be at the .362-.5 correction level similar to the left shoulder marked "s". The horizontal lines the the top are for time equality which often occurs with H&S formation.
Hope this is helpful. Other ideas always glad to see.
IF so the near term target may be at the .362-.5 correction level similar to the left shoulder marked "s". The horizontal lines the the top are for time equality which often occurs with H&S formation.
Hope this is helpful. Other ideas always glad to see.
Заметка
Obviously correction deeper than I expected, now down about to .62 level. Needs to begin going up hear for formation to hold.seekingalpha.com/article/4052615-big-gold-miners-sector-trouble

Отказ от ответственности
Информация и публикации не предназначены для предоставления и не являются финансовыми, инвестиционными, торговыми или другими видами советов или рекомендаций, предоставленных или одобренных TradingView. Подробнее читайте в Условиях использования.
Отказ от ответственности
Информация и публикации не предназначены для предоставления и не являются финансовыми, инвестиционными, торговыми или другими видами советов или рекомендаций, предоставленных или одобренных TradingView. Подробнее читайте в Условиях использования.