
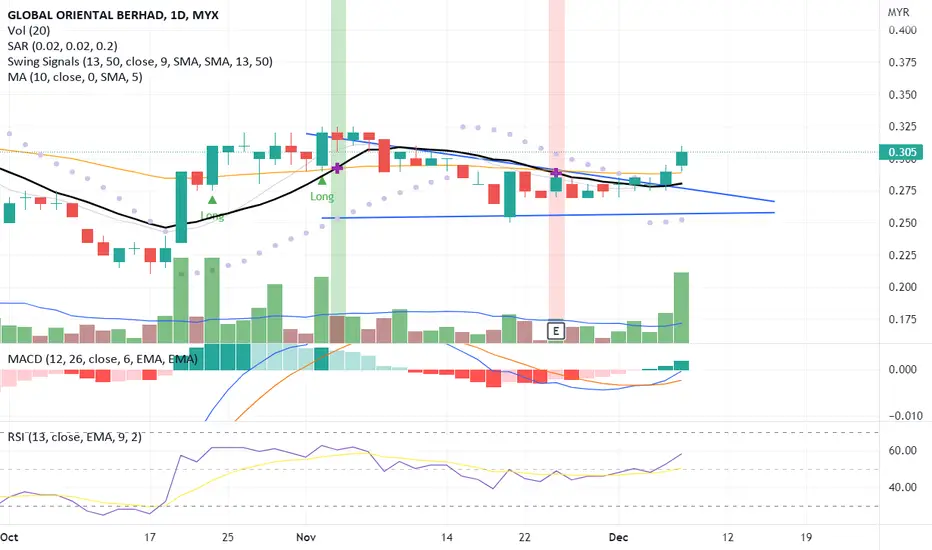
The candlestick pattern indicates a reversal signal and strong uptrend momentum where is closed above the MA50 line backed by high volume.
MACD indicators show a positive with a divergence signal confirming the price uptrend toward the next price resistance.
RSI indicates positive momentum due to fresh interest from the buyer pushing the price toward the next price resistance.
Let's save GOB in WL and watch out for significant price movement toward the next price resistance.
R 0.320
S 0.255
MACD indicators show a positive with a divergence signal confirming the price uptrend toward the next price resistance.
RSI indicates positive momentum due to fresh interest from the buyer pushing the price toward the next price resistance.
Let's save GOB in WL and watch out for significant price movement toward the next price resistance.
R 0.320
S 0.255

Отказ от ответственности
Информация и публикации не предназначены для предоставления и не являются финансовыми, инвестиционными, торговыми или другими видами советов или рекомендаций, предоставленных или одобренных TradingView. Подробнее читайте в Условиях использования.
Отказ от ответственности
Информация и публикации не предназначены для предоставления и не являются финансовыми, инвестиционными, торговыми или другими видами советов или рекомендаций, предоставленных или одобренных TradingView. Подробнее читайте в Условиях использования.