
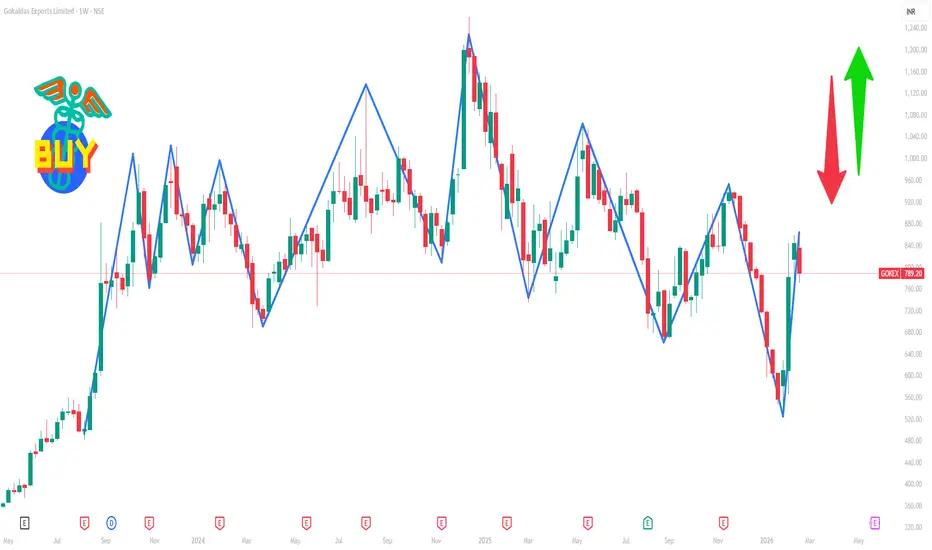
📌 Current Price Snapshot (approx)
Live/Latest close: ~₹787-₹790 per share (latest session close) — reference from consolidated data.
Today’s day range seen near: ~₹780 – ₹802.
52-week range: Low ~₹531, High ~₹1,060.
📊 Short-Term (1-Week) Key Levels
These levels reflect pivot/support/resistance zones that traders often watch over a short timeframe like 1 week:
📈 Resistance Levels (Upside)
₹800-₹812: First key resistance zone — near recent intra-day highs.
₹825-₹835: Important breakout hurdle if bulls push significantly higher.
₹858-₹876 area: Higher resistance range seen in some pivot data.
📉 Support Levels (Downside)
₹780-₹781: Immediate support — recent clustered price level.
₹764-₹775: Secondary support zone if price retests lower.
₹733-₹752: deeper support range — significant area below short-term pivots.
📍 Pivot / Mid-Range Reference
Pivot approx: ~₹820 (neutral reference point for short-term trend).
🧭 How to Interpret These Levels
Above ₹800–812: Bullish momentum may strengthen, potential move toward higher resistances.
Below ₹780: Could signal short-term weakness, testing lower support zones.
Range for this week: Roughly ₹764–₹835 as the key tradable band — barring strong breakout news.

Contact Knowledgehub for a detailed consultation: Dm on WhatsApp: [wa.link/a2o0kz]-
Phone No: [+91 93102 26243]-
Email: [tradingviewknowledgehub@gmail.com]---
-- Let’s achieve success together!
Phone No: [+91 93102 26243]-
Email: [tradingviewknowledgehub@gmail.com]---
-- Let’s achieve success together!
Похожие публикации
Отказ от ответственности
Информация и публикации не предназначены для предоставления и не являются финансовыми, инвестиционными, торговыми или другими видами советов или рекомендаций, предоставленных или одобренных TradingView. Подробнее читайте в Условиях использования.