
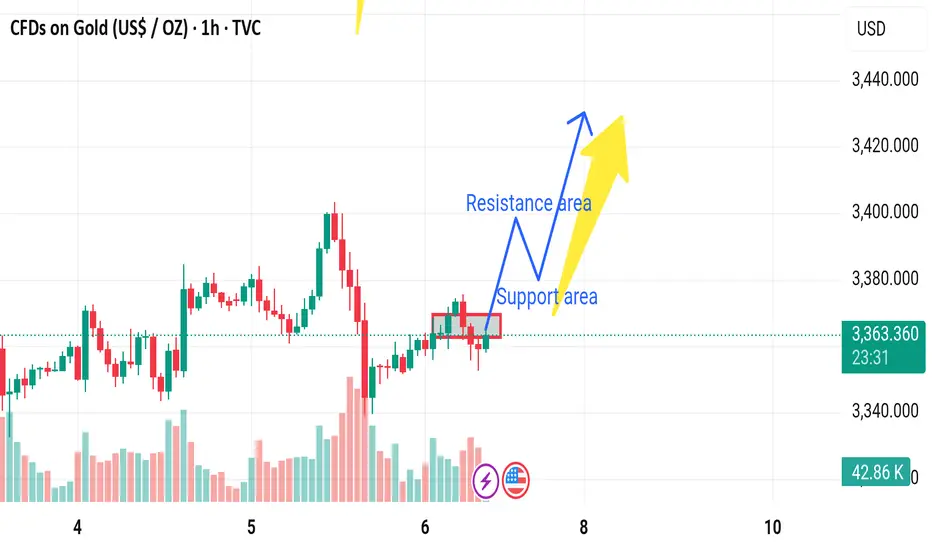
Bearish Disruption Analysis:
1. False Breakout Risk:
The current price is consolidating in a tight range.
The support area may fail to hold due to low volume and indecision (notice the decreasing volume in recent candles).
2. Lower High Formation:
A potential lower high is forming compared to the peak from earlier on June 5.
This could signal a trend reversal or weakening bullish momentum.
3. Volume Divergence:
The bullish candles have lower volume than previous strong moves, indicating a lack of strong buying interest.
4. Support Breakdown Scenario:
If price breaks below the marked support area (~3360), we could see:
Drop toward the 3340 area (next visible support).
Acceleration if stop-losses are triggered below the support zone.
1. False Breakout Risk:
The current price is consolidating in a tight range.
The support area may fail to hold due to low volume and indecision (notice the decreasing volume in recent candles).
2. Lower High Formation:
A potential lower high is forming compared to the peak from earlier on June 5.
This could signal a trend reversal or weakening bullish momentum.
3. Volume Divergence:
The bullish candles have lower volume than previous strong moves, indicating a lack of strong buying interest.
4. Support Breakdown Scenario:
If price breaks below the marked support area (~3360), we could see:
Drop toward the 3340 area (next visible support).
Acceleration if stop-losses are triggered below the support zone.

Отказ от ответственности
Информация и публикации не предназначены для предоставления и не являются финансовыми, инвестиционными, торговыми или другими видами советов или рекомендаций, предоставленных или одобренных TradingView. Подробнее читайте в Условиях использования.
Отказ от ответственности
Информация и публикации не предназначены для предоставления и не являются финансовыми, инвестиционными, торговыми или другими видами советов или рекомендаций, предоставленных или одобренных TradingView. Подробнее читайте в Условиях использования.