
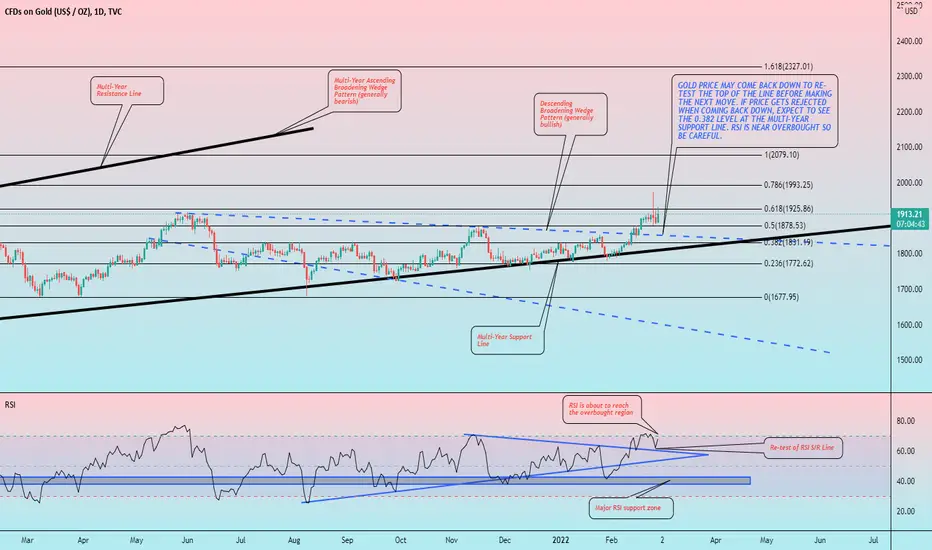
Hello friends, today you can review the technical analysis idea on a 1D linear scale chart for Gold.
The chart is self-explanatory. Gold price may come back down to re-test the top of the Descending Broadening Wedge Pattern. If price gets rejected when coming down, expect to see the 0.382 Fibonacci Retracement level to touch which is in line with the Multi-year Support Trend Line. RSI is near overbought on the daily chart so be careful.
If you enjoy my ideas, feel free to like it and drop in a comment. I love reading your comments below.
Disclosure: This is just my opinion and not any type of financial advice. I enjoy charting and discussing technical analysis. Don't trade based on my advice. Do your own research! #cryptopickk

Похожие публикации
Отказ от ответственности
Информация и публикации не предназначены для предоставления и не являются финансовыми, инвестиционными, торговыми или другими видами советов или рекомендаций, предоставленных или одобренных TradingView. Подробнее читайте в Условиях использования.
Похожие публикации
Отказ от ответственности
Информация и публикации не предназначены для предоставления и не являются финансовыми, инвестиционными, торговыми или другими видами советов или рекомендаций, предоставленных или одобренных TradingView. Подробнее читайте в Условиях использования.