
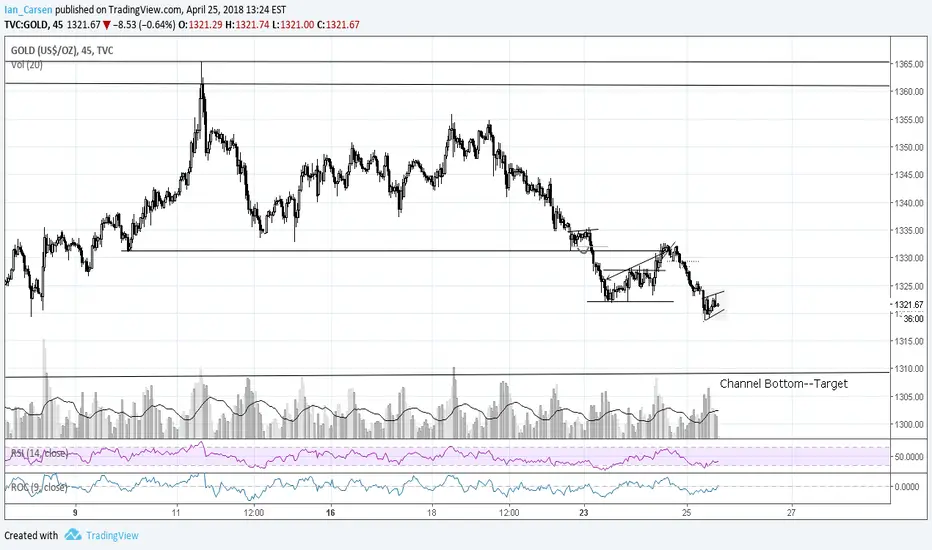
With recent dollar strength and treasury weakness, commodities are taking the hit. Here we have a classic bear flag in Gold A longer-term chart shows Gold in a large rectangular consolidation inside an ascending triangle (triangle on the weekly chart). A break of the bear flag should take price to the boundary of the larger rectangular consolidation, where price may proceed (probably after a partial rise) to fall to the boundary of the triangle, where I would expect it to reverse upwards, however, continuation of the downwards action is always possible.
Good trading and good luck!
Good trading and good luck!

Отказ от ответственности
Информация и публикации не предназначены для предоставления и не являются финансовыми, инвестиционными, торговыми или другими видами советов или рекомендаций, предоставленных или одобренных TradingView. Подробнее читайте в Условиях использования.
Отказ от ответственности
Информация и публикации не предназначены для предоставления и не являются финансовыми, инвестиционными, торговыми или другими видами советов или рекомендаций, предоставленных или одобренных TradingView. Подробнее читайте в Условиях использования.