
The AI Infrastructure Trade — A Probability Read on Where We Are
If you're holding from the broader AI infrastructure basket — NVDA, AVGO, AMD, ARM, MU, MRVL, TSM, LRCX, AMAT, KLAC, ASML, ANET, SMCI, DELL, HPE, VRT, ETN, PWR, HUBB, JCI, TT, GEV, CEG, VST, EQIX, DLR, GOOGL, AMZN, META, MSFT, plus SMH/QQQ/SPY benchmarks — here's what a multi-filter structural read says about the probability distribution of where the basket is likely going over the next 1-12 weeks. Not a recommendation, not a prediction. The structure speaking honestly about what it can and cannot say.
A note before reading. All trading indicators define probability distributions over future states. They never predict; they shift the conditional probability of outcomes given the observed signal. The cluster signal in this screen is no different. What follows isn't a claim that something has or will happen — it's a description of how the observable evidence shifts the relative likelihood of different scenarios. Read it as such.
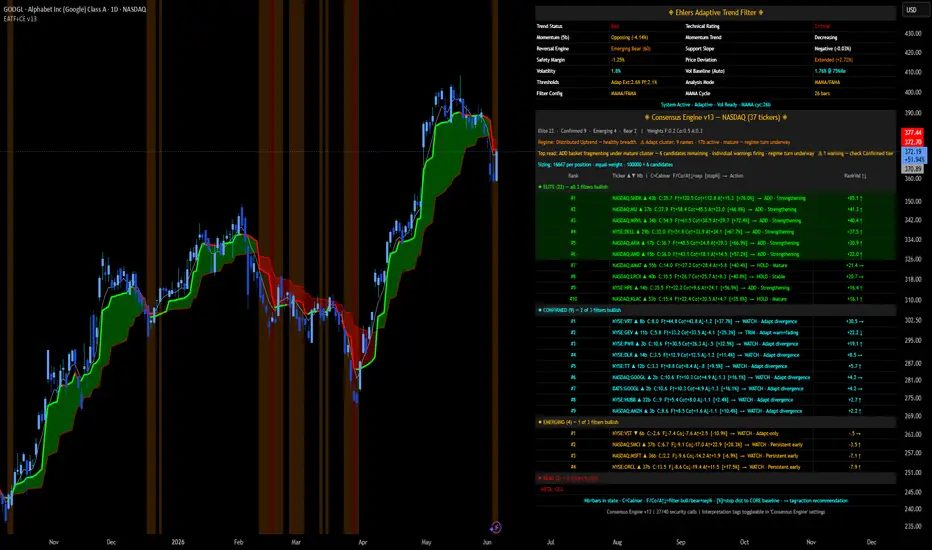
Where we are by the screen's measures. The broader AI infrastructure basket is showing what the indicator classifies as a "mature cluster" reading. Eight Confirmed-tier names show simultaneous cycle-adaptive bearish dissent (VRT, GEV, PWR, DLR, TT, GOOGL, HUBB, AMZN). The cluster has been active for 17 bars — roughly three and a half trading weeks. Individual warnings have begun firing on names crossing 10-bar persistence thresholds. The Elite count has contracted from a peak around 32 to 23. The actionable ADD·Strengthening basket has reduced from 17 to 7 candidates.
The indicator's role here is to surface the simultaneity of cycle-detector signals that no individual chart would show. Three weeks ago, the cycle-adaptive filter flipped bearish on five Elite-tier leadership names while every slower filter still saw clean uptrends. That's the kind of cross-name correlation the multi-filter consensus structure exists to detect. The cluster then expanded, persisted past the noise window, and matured to its current state. None of this happened overnight, and each stage was observable in real time.
What the indicator's reading shifts probabilities toward. A mature-cluster reading in a multi-filter framework historically correlates with higher conditional probability of three classes of outcome over the following 1-12 weeks. The relative weights I'd attach are necessarily soft — base rates for this specific configuration aren't reliably calibrated — but the direction of the probability shift is what the indicator structurally implies.
Class A: Digestion, no broad turn (probability ≈ 40-50%). The cluster stabilizes at current levels, Elite count holds at 20-24, individual warnings cap at 1-2 names. The basket absorbs the cycle-level pressure over 3-6 weeks. Drawdowns of 15-25% on the most extended names (the infrastructure-adjacent group: VRT, GEV, PWR, GOOGL, HUBB), 5-10% on the cleaner names, 0-5% on defensive sub-sectors (storage, equipment). Basing process begins within 3-6 weeks. Equipment layer never gets pulled in. Sub-sector rotation continues. This is the constructive resolution and is consistent with how AI/semi cycles have historically resolved when cluster pressure was real but contained to a specific sub-sector. It corresponds to the slower filters not propagating the cycle-detector's bearishness.
Class B: Broader weakness, propagation into chip designers (probability ≈ 30-40%). The cluster expands to 12-15 names. Adapt-divergence appears on at least one of NVDA, AMD, AVGO. Elite count contracts to 15-18. Infrastructure-adjacent names that have already given back 15-25% give back another 10-20%. Chip designers see 10-20% drawdowns from current levels. The basket transitions to "Transitional — mixed regime" on the screen's classifier. Time to basing: 6-12 weeks from current state. This is the medium-severity resolution — a broader AI cycle pause, not collapse. Equipment layer typically resists 4-8 weeks before participating in this scenario.
Class C: Full semi-cycle turn (probability ≈ 10-20%). Adapt-divergence propagates to the equipment layer (ASML, AMAT, LRCX, KLAC). Cluster expands to 15+ names. Elite count below 15. The screen reaches "Risk-Off — breadth deteriorating." This is the full semiconductor cycle turn scenario, similar in shape to 2022 but unfolding over its own timeframe. Drawdowns of 30-50% on extended names, 15-30% on cleaner ones. Time to basing: 4-8 months. This is the tail-risk resolution and would require the cluster pressure to propagate through layers that have so far remained clean.
These probabilities aren't calibrated against a large sample of historical cluster maturations in this exact configuration — that sample doesn't exist. They're directional estimates from the structural read of the indicator alone, drawing on broader pattern-recognition about how multi-filter cycle pressure tends to resolve in tech baskets. Treat them as ordinal (A > B > C in likelihood) rather than as precise point estimates. The point is the direction of probability mass, not the exact percentages.
What would shift probabilities further as evidence accumulates. This is what makes the indicator useful in real time. Each of the next several sessions will produce observable evidence that shifts the probability distribution toward one class or another.
Evidence shifting toward Class A (digestion). Cluster count stabilizes at 8 or drops to 6-7. Elite count holds steady at 23 or drifts up. No new cluster names appear. Equipment layer remains clean. Sub-sector rotation continues with defensive names outperforming infrastructure names. Storage and memory hold up while cluster-adjacent names continue to underperform. Each of these shifts probability away from B and C and toward A.
Evidence shifting toward Class B (broader weakness). Cluster count expands toward 10-12. Adapt-divergence appears on at least one chip designer (NVDA, AMD, AVGO). Elite count drifts toward 18-20. The semi-defensive names (storage, memory) start participating in basket weakness with drawdowns matching the infrastructure layer. Hyperscaler cohort behavior degrades together (GOOGL, AMZN, META, MSFT moving in coordinated weakness rather than independently). Each shifts probability toward B.
Evidence shifting toward Class C (full cycle turn). Adapt-divergence appears on any of ASML, AMAT, LRCX, KLAC. Cluster count expands past 12. Elite count drops below 15. The screen's regime classifier moves to "Risk-Off." This is the threshold where the read changes materially. As long as equipment stays clean, C remains tail-risk.
The structural canary is the equipment layer. Right now ASML, AMAT, LRCX, KLAC are all in Elite with no Adapt-divergence. They're the layer most resistant to short-term cycle pressure (equipment orders are committed 12-18 months ahead of underlying demand). If they remain clean, probability mass stays in A and B. If they get pulled in, probability shifts meaningfully toward C.
The sub-sector pattern as it stands. The cluster pressure is concentrated, not basket-wide. It's showing up in the capex-buyer layer of the AI infrastructure chain: data-center power (VRT, GEV, PWR, ETN), data-center real estate (DLR, EQIX adjacency), networking infrastructure (HUBB, TT), and mega-cap hyperscalers (GOOGL, AMZN — the buyers of the infrastructure). The chip designer layer remains structurally cleaner. The equipment layer is cleanest. The storage/memory defensive sub-sector has been holding up (SNDK, WDC up while broader basket is down).
This pattern is informative. It suggests the cycle-level pressure is hitting the part of the AI capex cycle that ran hardest into peak data-center buildout euphoria — the cooling, power, networking layer — while the underlying technology cycle (chip design, equipment) remains on its own dynamics. If this pattern persists, it's an argument for Class A — sub-sector rotation within an intact basket rather than basket-wide turn. If the pattern breaks (defensive sub-sectors start participating in weakness), it's an argument for B or C.
What this means practically for someone holding the basket. The probability distribution above shifts the conditional expected value of holding extended positions in the cluster-adjacent names lower than it was four weeks ago. Whether that's enough to justify action depends on factors outside the indicator — your conviction in the secular AI thesis, your time horizon, your tax situation, your tolerance for further drawdown.
What the indicator can say with structural confidence: the most extended names in the cluster-adjacent sub-sectors (highest RankVal in the cooling/power/networking layer) are the most exposed to further downside across all three scenarios. Trimming exposure here doesn't bet on any specific scenario — it reduces exposure proportional to the probability-weighted downside across the distribution.
What the indicator cannot tell you: whether the AI capex cycle is fundamentally over or pausing within a 5-year secular uptrend. The cluster signal detects cycle-level turns at 17-bar lead times. It doesn't distinguish secular ending from cyclical pause. That distinction is made by fundamental analysis, demand trajectories, and time — not by an indicator.
What to watch over the next 1-4 weeks. The signposts above, in priority order: equipment layer remaining clean (most important — if it changes, the read changes), chip designer layer remaining clean (second most important — if Adapt-divergence appears here, Class A weakens), cluster count direction (continues growing → B; stabilizes → A; drops → A more strongly), Elite count direction, defensive sub-sector behavior (holding up → A; participating in weakness → B/C). Each session's update on these dimensions shifts the probability distribution. By 4 weeks from now, the distinction between A, B, and C should be substantially clearer than it is now.
What the indicator's role actually is in all this. The structural read can detect the cluster-level pressure 17 bars before slower indicators confirm. It can name the signposts that distinguish scenarios as evidence accumulates. It can show, in real time, which scenario is becoming more likely. What it cannot do is tell you what will happen. The future remains uncertain; what shifts is the distribution over possible futures, not certainty about any single one.
A reader who internalizes that distinction is positioned to use the indicator well: watch the signposts, update the probability distribution as evidence accumulates, make decisions consistent with that probability-weighted view rather than betting on a single outcome. A reader who treats the indicator as predictive will either over-commit to one scenario and be punished when probability resolves elsewhere, or distrust the indicator entirely when it doesn't perform like a forecaster. Both readings miss what the indicator actually is.
The honest closing. Three weeks ago this basket showed early cluster pressure that could have been noise. Now it shows mature cluster pressure with corroborating evidence (Elite count contraction, individual warnings firing, sub-sector rotation visible in price action). The probability distribution over the next 1-12 weeks has shifted meaningfully toward the digestion-or-worse scenarios and away from the clean-continuation outcome. Whether any individual scenario plays out is unknowable. That the distribution has shifted is observable in the screen.
Tomorrow's reading will update the distribution again. The signposts are named. The probability framework is the right way to hold this — not as a bet on any single outcome but as a real-time updating view of where the structural evidence sits.
Not a recommendation. Not a prediction. A probability read on where the basket structurally is.
If you're holding from the broader AI infrastructure basket — NVDA, AVGO, AMD, ARM, MU, MRVL, TSM, LRCX, AMAT, KLAC, ASML, ANET, SMCI, DELL, HPE, VRT, ETN, PWR, HUBB, JCI, TT, GEV, CEG, VST, EQIX, DLR, GOOGL, AMZN, META, MSFT, plus SMH/QQQ/SPY benchmarks — here's what a multi-filter structural read says about the probability distribution of where the basket is likely going over the next 1-12 weeks. Not a recommendation, not a prediction. The structure speaking honestly about what it can and cannot say.
A note before reading. All trading indicators define probability distributions over future states. They never predict; they shift the conditional probability of outcomes given the observed signal. The cluster signal in this screen is no different. What follows isn't a claim that something has or will happen — it's a description of how the observable evidence shifts the relative likelihood of different scenarios. Read it as such.
Where we are by the screen's measures. The broader AI infrastructure basket is showing what the indicator classifies as a "mature cluster" reading. Eight Confirmed-tier names show simultaneous cycle-adaptive bearish dissent (VRT, GEV, PWR, DLR, TT, GOOGL, HUBB, AMZN). The cluster has been active for 17 bars — roughly three and a half trading weeks. Individual warnings have begun firing on names crossing 10-bar persistence thresholds. The Elite count has contracted from a peak around 32 to 23. The actionable ADD·Strengthening basket has reduced from 17 to 7 candidates.
The indicator's role here is to surface the simultaneity of cycle-detector signals that no individual chart would show. Three weeks ago, the cycle-adaptive filter flipped bearish on five Elite-tier leadership names while every slower filter still saw clean uptrends. That's the kind of cross-name correlation the multi-filter consensus structure exists to detect. The cluster then expanded, persisted past the noise window, and matured to its current state. None of this happened overnight, and each stage was observable in real time.
What the indicator's reading shifts probabilities toward. A mature-cluster reading in a multi-filter framework historically correlates with higher conditional probability of three classes of outcome over the following 1-12 weeks. The relative weights I'd attach are necessarily soft — base rates for this specific configuration aren't reliably calibrated — but the direction of the probability shift is what the indicator structurally implies.
Class A: Digestion, no broad turn (probability ≈ 40-50%). The cluster stabilizes at current levels, Elite count holds at 20-24, individual warnings cap at 1-2 names. The basket absorbs the cycle-level pressure over 3-6 weeks. Drawdowns of 15-25% on the most extended names (the infrastructure-adjacent group: VRT, GEV, PWR, GOOGL, HUBB), 5-10% on the cleaner names, 0-5% on defensive sub-sectors (storage, equipment). Basing process begins within 3-6 weeks. Equipment layer never gets pulled in. Sub-sector rotation continues. This is the constructive resolution and is consistent with how AI/semi cycles have historically resolved when cluster pressure was real but contained to a specific sub-sector. It corresponds to the slower filters not propagating the cycle-detector's bearishness.
Class B: Broader weakness, propagation into chip designers (probability ≈ 30-40%). The cluster expands to 12-15 names. Adapt-divergence appears on at least one of NVDA, AMD, AVGO. Elite count contracts to 15-18. Infrastructure-adjacent names that have already given back 15-25% give back another 10-20%. Chip designers see 10-20% drawdowns from current levels. The basket transitions to "Transitional — mixed regime" on the screen's classifier. Time to basing: 6-12 weeks from current state. This is the medium-severity resolution — a broader AI cycle pause, not collapse. Equipment layer typically resists 4-8 weeks before participating in this scenario.
Class C: Full semi-cycle turn (probability ≈ 10-20%). Adapt-divergence propagates to the equipment layer (ASML, AMAT, LRCX, KLAC). Cluster expands to 15+ names. Elite count below 15. The screen reaches "Risk-Off — breadth deteriorating." This is the full semiconductor cycle turn scenario, similar in shape to 2022 but unfolding over its own timeframe. Drawdowns of 30-50% on extended names, 15-30% on cleaner ones. Time to basing: 4-8 months. This is the tail-risk resolution and would require the cluster pressure to propagate through layers that have so far remained clean.
These probabilities aren't calibrated against a large sample of historical cluster maturations in this exact configuration — that sample doesn't exist. They're directional estimates from the structural read of the indicator alone, drawing on broader pattern-recognition about how multi-filter cycle pressure tends to resolve in tech baskets. Treat them as ordinal (A > B > C in likelihood) rather than as precise point estimates. The point is the direction of probability mass, not the exact percentages.
What would shift probabilities further as evidence accumulates. This is what makes the indicator useful in real time. Each of the next several sessions will produce observable evidence that shifts the probability distribution toward one class or another.
Evidence shifting toward Class A (digestion). Cluster count stabilizes at 8 or drops to 6-7. Elite count holds steady at 23 or drifts up. No new cluster names appear. Equipment layer remains clean. Sub-sector rotation continues with defensive names outperforming infrastructure names. Storage and memory hold up while cluster-adjacent names continue to underperform. Each of these shifts probability away from B and C and toward A.
Evidence shifting toward Class B (broader weakness). Cluster count expands toward 10-12. Adapt-divergence appears on at least one chip designer (NVDA, AMD, AVGO). Elite count drifts toward 18-20. The semi-defensive names (storage, memory) start participating in basket weakness with drawdowns matching the infrastructure layer. Hyperscaler cohort behavior degrades together (GOOGL, AMZN, META, MSFT moving in coordinated weakness rather than independently). Each shifts probability toward B.
Evidence shifting toward Class C (full cycle turn). Adapt-divergence appears on any of ASML, AMAT, LRCX, KLAC. Cluster count expands past 12. Elite count drops below 15. The screen's regime classifier moves to "Risk-Off." This is the threshold where the read changes materially. As long as equipment stays clean, C remains tail-risk.
The structural canary is the equipment layer. Right now ASML, AMAT, LRCX, KLAC are all in Elite with no Adapt-divergence. They're the layer most resistant to short-term cycle pressure (equipment orders are committed 12-18 months ahead of underlying demand). If they remain clean, probability mass stays in A and B. If they get pulled in, probability shifts meaningfully toward C.
The sub-sector pattern as it stands. The cluster pressure is concentrated, not basket-wide. It's showing up in the capex-buyer layer of the AI infrastructure chain: data-center power (VRT, GEV, PWR, ETN), data-center real estate (DLR, EQIX adjacency), networking infrastructure (HUBB, TT), and mega-cap hyperscalers (GOOGL, AMZN — the buyers of the infrastructure). The chip designer layer remains structurally cleaner. The equipment layer is cleanest. The storage/memory defensive sub-sector has been holding up (SNDK, WDC up while broader basket is down).
This pattern is informative. It suggests the cycle-level pressure is hitting the part of the AI capex cycle that ran hardest into peak data-center buildout euphoria — the cooling, power, networking layer — while the underlying technology cycle (chip design, equipment) remains on its own dynamics. If this pattern persists, it's an argument for Class A — sub-sector rotation within an intact basket rather than basket-wide turn. If the pattern breaks (defensive sub-sectors start participating in weakness), it's an argument for B or C.
What this means practically for someone holding the basket. The probability distribution above shifts the conditional expected value of holding extended positions in the cluster-adjacent names lower than it was four weeks ago. Whether that's enough to justify action depends on factors outside the indicator — your conviction in the secular AI thesis, your time horizon, your tax situation, your tolerance for further drawdown.
What the indicator can say with structural confidence: the most extended names in the cluster-adjacent sub-sectors (highest RankVal in the cooling/power/networking layer) are the most exposed to further downside across all three scenarios. Trimming exposure here doesn't bet on any specific scenario — it reduces exposure proportional to the probability-weighted downside across the distribution.
What the indicator cannot tell you: whether the AI capex cycle is fundamentally over or pausing within a 5-year secular uptrend. The cluster signal detects cycle-level turns at 17-bar lead times. It doesn't distinguish secular ending from cyclical pause. That distinction is made by fundamental analysis, demand trajectories, and time — not by an indicator.
What to watch over the next 1-4 weeks. The signposts above, in priority order: equipment layer remaining clean (most important — if it changes, the read changes), chip designer layer remaining clean (second most important — if Adapt-divergence appears here, Class A weakens), cluster count direction (continues growing → B; stabilizes → A; drops → A more strongly), Elite count direction, defensive sub-sector behavior (holding up → A; participating in weakness → B/C). Each session's update on these dimensions shifts the probability distribution. By 4 weeks from now, the distinction between A, B, and C should be substantially clearer than it is now.
What the indicator's role actually is in all this. The structural read can detect the cluster-level pressure 17 bars before slower indicators confirm. It can name the signposts that distinguish scenarios as evidence accumulates. It can show, in real time, which scenario is becoming more likely. What it cannot do is tell you what will happen. The future remains uncertain; what shifts is the distribution over possible futures, not certainty about any single one.
A reader who internalizes that distinction is positioned to use the indicator well: watch the signposts, update the probability distribution as evidence accumulates, make decisions consistent with that probability-weighted view rather than betting on a single outcome. A reader who treats the indicator as predictive will either over-commit to one scenario and be punished when probability resolves elsewhere, or distrust the indicator entirely when it doesn't perform like a forecaster. Both readings miss what the indicator actually is.
The honest closing. Three weeks ago this basket showed early cluster pressure that could have been noise. Now it shows mature cluster pressure with corroborating evidence (Elite count contraction, individual warnings firing, sub-sector rotation visible in price action). The probability distribution over the next 1-12 weeks has shifted meaningfully toward the digestion-or-worse scenarios and away from the clean-continuation outcome. Whether any individual scenario plays out is unknowable. That the distribution has shifted is observable in the screen.
Tomorrow's reading will update the distribution again. The signposts are named. The probability framework is the right way to hold this — not as a bet on any single outcome but as a real-time updating view of where the structural evidence sits.
Not a recommendation. Not a prediction. A probability read on where the basket structurally is.

Отказ от ответственности
Информация и публикации не предназначены для предоставления и не являются финансовыми, инвестиционными, торговыми или другими видами советов или рекомендаций, предоставленных или одобренных TradingView. Подробнее читайте в Условиях использования.
Отказ от ответственности
Информация и публикации не предназначены для предоставления и не являются финансовыми, инвестиционными, торговыми или другими видами советов или рекомендаций, предоставленных или одобренных TradingView. Подробнее читайте в Условиях использования.