
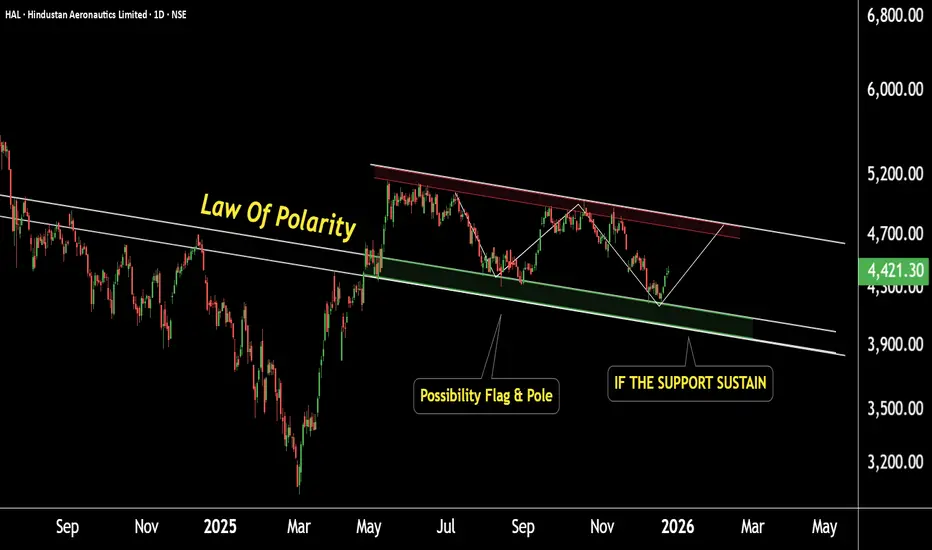
This is the daily timeframe chart of HAL.
HAL is showing a strong Law of Polarity (LOP) support near the ₹4050–4100 zone.
The stock is currently trading within a falling channel, with the channel support aligning closely with the same LOP support area.
This structure indicates the possibility of a flag and pole pattern formation. If the channel support continues to hold,
the stock may attempt a move towards the channel resistance zone near ₹4750–4800.
Thank you.
HAL is showing a strong Law of Polarity (LOP) support near the ₹4050–4100 zone.
The stock is currently trading within a falling channel, with the channel support aligning closely with the same LOP support area.
This structure indicates the possibility of a flag and pole pattern formation. If the channel support continues to hold,
the stock may attempt a move towards the channel resistance zone near ₹4750–4800.
Thank you.

@RahulSarawagi
Connect us at optionlab.co.in/
Connect us at optionlab.co.in/
Отказ от ответственности
Информация и публикации не предназначены для предоставления и не являются финансовыми, инвестиционными, торговыми или другими видами советов или рекомендаций, предоставленных или одобренных TradingView. Подробнее читайте в Условиях использования.
@RahulSarawagi
Connect us at optionlab.co.in/
Connect us at optionlab.co.in/
Отказ от ответственности
Информация и публикации не предназначены для предоставления и не являются финансовыми, инвестиционными, торговыми или другими видами советов или рекомендаций, предоставленных или одобренных TradingView. Подробнее читайте в Условиях использования.