
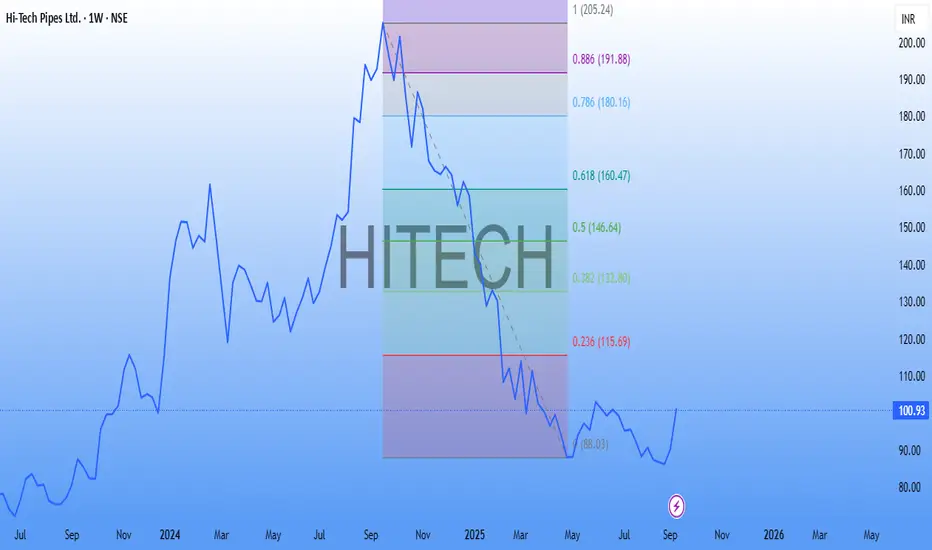
📊 Hi-Tech Pipes Ltd (NSE: HITECH) – Weekly Technical Analysis
The stock has witnessed a prolonged downtrend from its highs and recently formed a strong bullish reversal candle, signaling a potential short-term trend reversal. Key indicators are also turning positive, supporting the possibility of an upward move.
🔎 Technical Observations
Price Action:
After a steep fall from ~₹140 levels, the stock took support near ₹88–90.
A strong green weekly candle has appeared with good momentum, suggesting renewed buying interest.
RSI has bounced from oversold territory, indicating strength.
MACD has shown a bullish crossover, with the histogram turning green, confirming momentum shift.
The recent bullish candle was backed by higher-than-average volume, a sign of accumulation.
📌 Trading Plan
Entry Zone: ₹95 – ₹102
Stop-Loss: ₹88 (weekly close basis)
Target 1: ₹110 – ₹115
Target 2: ₹125 – ₹130
Target 3: ₹140 – ₹145
⚠️ Key Notes
Sustaining above ₹115 with strong volume will be crucial for further upside.
Since the broader trend is still weak, treat this as a pullback rally until the stock closes above ₹130+.
Booking partial profits at each target level is advised to protect gains.
📢 Conclusion
Hi-Tech Pipes Ltd is showing early signs of a reversal after a long decline. The combination of price action, momentum indicators, and support zone bounce makes it an attractive short-term opportunity. However, strict stop-loss management is necessary given the prior downtrend.
Сделка активна
High made 123.30. Tanked 20% in a weekЗаметка
HIgh made 127
Отказ от ответственности
Информация и публикации не предназначены для предоставления и не являются финансовыми, инвестиционными, торговыми или другими видами советов или рекомендаций, предоставленных или одобренных TradingView. Подробнее читайте в Условиях использования.
Отказ от ответственности
Информация и публикации не предназначены для предоставления и не являются финансовыми, инвестиционными, торговыми или другими видами советов или рекомендаций, предоставленных или одобренных TradingView. Подробнее читайте в Условиях использования.