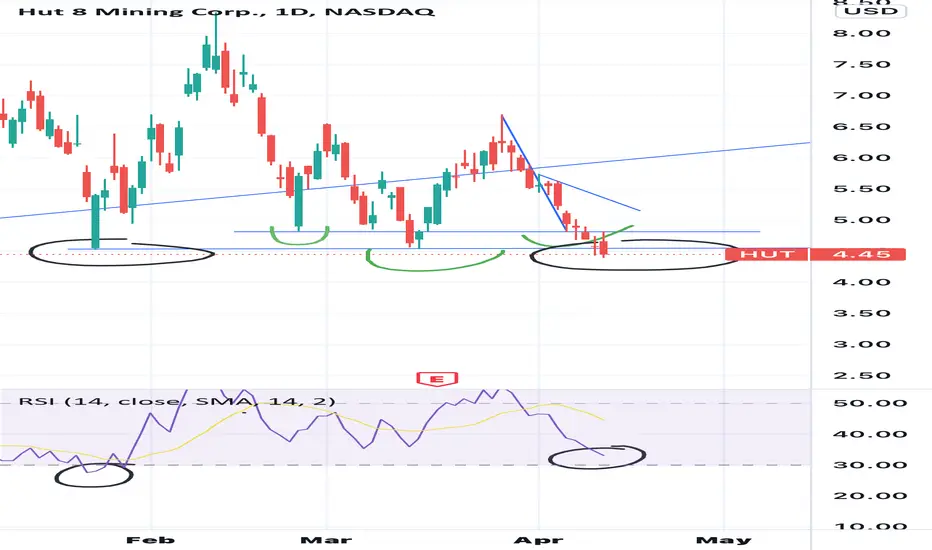
HUT broke down from the inverse head and shoulders. It even has candle confirmation - spinning doji followed by bearish engulfing. It is fair to say that the IHS is NEGATED.
I see 2 bullish scenarios here on HUT . In this order:
1. Bullish divergence on $HUT. It can bounce righy here on the 4.50 support and see much higher levels: 4.8, 5, 5.5 and even higher levels.
2.HUT loses the bearish divergence and goes for oversold zone (below 30 RSI and under). It can try to bounce here.
Thanks for reading. What do you think?
This is not financial advice. This is solely for entertainment purposes. Do not take anything from this idea as advice in any way, shape, or form.
I see 2 bullish scenarios here on
HUT . In this order: 1. Bullish divergence on $HUT. It can bounce righy here on the 4.50 support and see much higher levels: 4.8, 5, 5.5 and even higher levels.
2.
HUT loses the bearish divergence and goes for oversold zone (below 30 RSI and under). It can try to bounce here.Thanks for reading. What do you think?
This is not financial advice. This is solely for entertainment purposes. Do not take anything from this idea as advice in any way, shape, or form.

Похожие публикации
Отказ от ответственности
Информация и публикации не предназначены для предоставления и не являются финансовыми, инвестиционными, торговыми или другими видами советов или рекомендаций, предоставленных или одобренных TradingView. Подробнее читайте в Условиях использования.
Похожие публикации
Отказ от ответственности
Информация и публикации не предназначены для предоставления и не являются финансовыми, инвестиционными, торговыми или другими видами советов или рекомендаций, предоставленных или одобренных TradingView. Подробнее читайте в Условиях использования.