IBM Rose 50%+ in Weeks, Then Retreated. What Its Chart Says Now
IBM  IBM has pulled back some 15% in recent days after rising 50%+ to a record high in less than two weeks on word the Trump administration will give "Big Blue" $1 billion to develop quantum-computing chips. Let's see what IBM's chart and fundamentals say could happen from here.
IBM's Fundamental Analysis
IBM shot up 12.4% on May 21 alone after the U.S. Commerce Department announced nine letters of intent to provide American firms with more than $2 billion in incentives to build out of a domestic quantum-computing supply chain.
Quantum computers are new devices under development that would use the physics principles of quantum mechanics to operate much faster than traditional computers do.
Commerce plans to give IBM $1 billion -- or roughly half of the total money, which is coming from funds set aside under former President Joe Biden's 2022 CHIPS and Science Act.
IBM intends to use the funds (and $1 billion of its own money) to launch "Anderon," America's first pure-play quantum-computing-chip foundry.
The Commerce Department is also providing up to $375 million in funding per company to D-Wave $NYSE:QBTS, Rigetti RGTI, Quantinuum
  QNT, Infleqtion
  INFQ, GlobalFoundries
  GFS and four other smaller, privately held quantum-computing companies. (The U.S. government will receive non-controlling equity stakes in some of them in exchange.)
Meanwhile, IBM also recently announced a separate $10 billion commitment over the next five years to further develop its quantum-computing offerings. (To date, IBM has deployed more than 90 quantum systems.)
And a few days after the Commerce Department's funding announcement, Big Blue and its Red Hat subsidiary unveiled Project Lightwell, a $5 billion commitment to create a new clearinghouse for open-source software with a new-frontier AI model. This project will require more than 20,000 engineers to help enterprises secure open-source software.
IBM's Technical Analysis
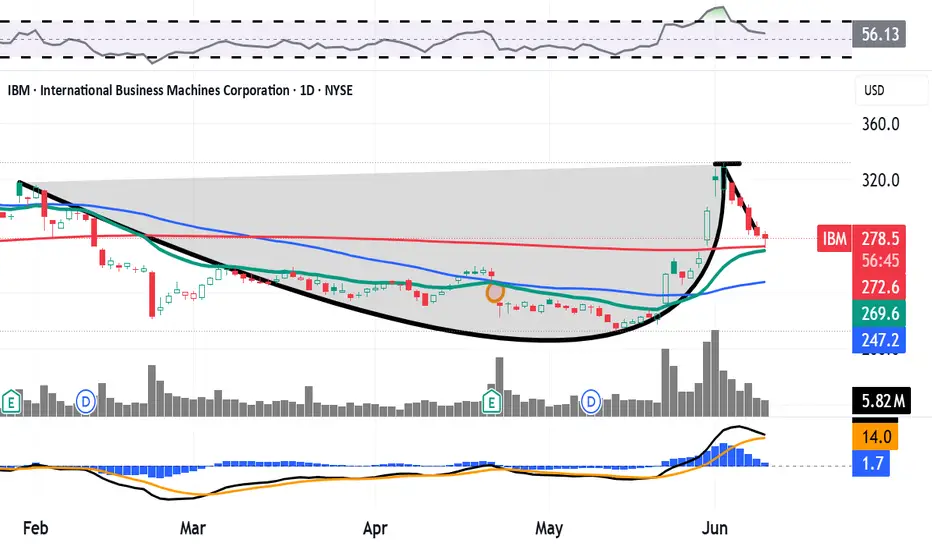
All of those seemingly positive catalysts sent IBM's stock rising sharply between mid-May and early June. Here's the stock's chart going back some six months and running through Monday morning:

Readers will first see that after falling out of bed late this past winter, IBM's shares developed a rectangle pattern over the following three-month period. Marked with three black lines in the chart's center, this pattern had a $258 apparent pivot.
IBM then broke out of this pattern in mid-May in response to all of the quantum-computing news. And in doing so, the stock took back its 21-day Exponential Moving Average (or "EMA," marked with a green line), its 50-day Simple Moving Average (or "SMA," denoted by a blue line) and its 200-day SMA (the red line).
Looking at the above chart's other technical indicators, IBM's Relative Strength Index (the gray line at the chart's top) is still quite robust, but has come off of a technically overbought level.
Similarly, the stock's Moving Average Convergence Divergence indicator (or "MACD," marked with blue bars, a black line and a gold line at the chart's bottom) has a lot of bullish momentum.
For instance, the histogram of the 9-day EMA (the blue bars) is now well into bullish territory. And at the same time, the 12-day EMA (the black line) is holding its ground above the 26-day EMA (the gold line). That's bullish as well.
What if we strip away the above rectangle pattern? Let's take a look:

In this view, we see that IBM has developed a bullish-looking cup-with-handle pattern, albeit one that's a little lopsided.
(Moomoo Technologies Inc. Markets Commentator Stephen "Sarge" Guilfoyle was long IBM at the time of writing this column.)
This article discusses technical analysis, other approaches, including fundamental analysis, may offer very different views. The examples provided are for illustrative purposes only and are not intended to be reflective of the results you can expect to achieve. Specific security charts used are for illustrative purposes only and are not a recommendation, offer to sell, or a solicitation of an offer to buy any security. Past investment performance does not indicate or guarantee future success. Returns will vary, and all investments carry risks, including loss of principal. This content is also not a research report and is not intended to serve as the basis for any investment decision. The information contained in this article does not purport to be a complete description of the securities, markets, or developments referred to in this material. Moomoo and its affiliates make no representation or warranty as to the article's adequacy, completeness, accuracy or timeliness for any particular purpose of the above content. Furthermore, there is no guarantee that any statements, estimates, price targets, opinions or forecasts provided herein will prove to be correct.
Moomoo is a financial information and trading app offered by Moomoo Technologies Inc. In the U.S., investment products and services on Moomoo are offered by Moomoo Financial Inc., Member FINRA/SIPC.
TradingView is an independent third party not affiliated with Moomoo Financial Inc., Moomoo Technologies Inc., or its affiliates. Moomoo Financial Inc. and its affiliates do not endorse, represent or warrant the completeness and accuracy of the data and information available on the TradingView platform and are not responsible for any services provided by the third-party platform.
IBM has pulled back some 15% in recent days after rising 50%+ to a record high in less than two weeks on word the Trump administration will give "Big Blue" $1 billion to develop quantum-computing chips. Let's see what IBM's chart and fundamentals say could happen from here.IBM's Fundamental Analysis
IBM shot up 12.4% on May 21 alone after the U.S. Commerce Department announced nine letters of intent to provide American firms with more than $2 billion in incentives to build out of a domestic quantum-computing supply chain.
Quantum computers are new devices under development that would use the physics principles of quantum mechanics to operate much faster than traditional computers do.
Commerce plans to give IBM $1 billion -- or roughly half of the total money, which is coming from funds set aside under former President Joe Biden's 2022 CHIPS and Science Act.
IBM intends to use the funds (and $1 billion of its own money) to launch "Anderon," America's first pure-play quantum-computing-chip foundry.
The Commerce Department is also providing up to $375 million in funding per company to D-Wave $NYSE:QBTS, Rigetti
RGTI, Quantinuum QNT, Infleqtion INFQ, GlobalFoundries GFS and four other smaller, privately held quantum-computing companies. (The U.S. government will receive non-controlling equity stakes in some of them in exchange.)Meanwhile, IBM also recently announced a separate $10 billion commitment over the next five years to further develop its quantum-computing offerings. (To date, IBM has deployed more than 90 quantum systems.)
And a few days after the Commerce Department's funding announcement, Big Blue and its Red Hat subsidiary unveiled Project Lightwell, a $5 billion commitment to create a new clearinghouse for open-source software with a new-frontier AI model. This project will require more than 20,000 engineers to help enterprises secure open-source software.
IBM's Technical Analysis
All of those seemingly positive catalysts sent IBM's stock rising sharply between mid-May and early June. Here's the stock's chart going back some six months and running through Monday morning:
Readers will first see that after falling out of bed late this past winter, IBM's shares developed a rectangle pattern over the following three-month period. Marked with three black lines in the chart's center, this pattern had a $258 apparent pivot.
IBM then broke out of this pattern in mid-May in response to all of the quantum-computing news. And in doing so, the stock took back its 21-day Exponential Moving Average (or "EMA," marked with a green line), its 50-day Simple Moving Average (or "SMA," denoted by a blue line) and its 200-day SMA (the red line).
Looking at the above chart's other technical indicators, IBM's Relative Strength Index (the gray line at the chart's top) is still quite robust, but has come off of a technically overbought level.
Similarly, the stock's Moving Average Convergence Divergence indicator (or "MACD," marked with blue bars, a black line and a gold line at the chart's bottom) has a lot of bullish momentum.
For instance, the histogram of the 9-day EMA (the blue bars) is now well into bullish territory. And at the same time, the 12-day EMA (the black line) is holding its ground above the 26-day EMA (the gold line). That's bullish as well.
What if we strip away the above rectangle pattern? Let's take a look:
In this view, we see that IBM has developed a bullish-looking cup-with-handle pattern, albeit one that's a little lopsided.
(Moomoo Technologies Inc. Markets Commentator Stephen "Sarge" Guilfoyle was long IBM at the time of writing this column.)
This article discusses technical analysis, other approaches, including fundamental analysis, may offer very different views. The examples provided are for illustrative purposes only and are not intended to be reflective of the results you can expect to achieve. Specific security charts used are for illustrative purposes only and are not a recommendation, offer to sell, or a solicitation of an offer to buy any security. Past investment performance does not indicate or guarantee future success. Returns will vary, and all investments carry risks, including loss of principal. This content is also not a research report and is not intended to serve as the basis for any investment decision. The information contained in this article does not purport to be a complete description of the securities, markets, or developments referred to in this material. Moomoo and its affiliates make no representation or warranty as to the article's adequacy, completeness, accuracy or timeliness for any particular purpose of the above content. Furthermore, there is no guarantee that any statements, estimates, price targets, opinions or forecasts provided herein will prove to be correct.
Moomoo is a financial information and trading app offered by Moomoo Technologies Inc. In the U.S., investment products and services on Moomoo are offered by Moomoo Financial Inc., Member FINRA/SIPC.
TradingView is an independent third party not affiliated with Moomoo Financial Inc., Moomoo Technologies Inc., or its affiliates. Moomoo Financial Inc. and its affiliates do not endorse, represent or warrant the completeness and accuracy of the data and information available on the TradingView platform and are not responsible for any services provided by the third-party platform.

Отказ от ответственности
Информация и публикации не предназначены для предоставления и не являются финансовыми, инвестиционными, торговыми или другими видами советов или рекомендаций, предоставленных или одобренных TradingView. Подробнее читайте в Условиях использования.
Отказ от ответственности
Информация и публикации не предназначены для предоставления и не являются финансовыми, инвестиционными, торговыми или другими видами советов или рекомендаций, предоставленных или одобренных TradingView. Подробнее читайте в Условиях использования.