
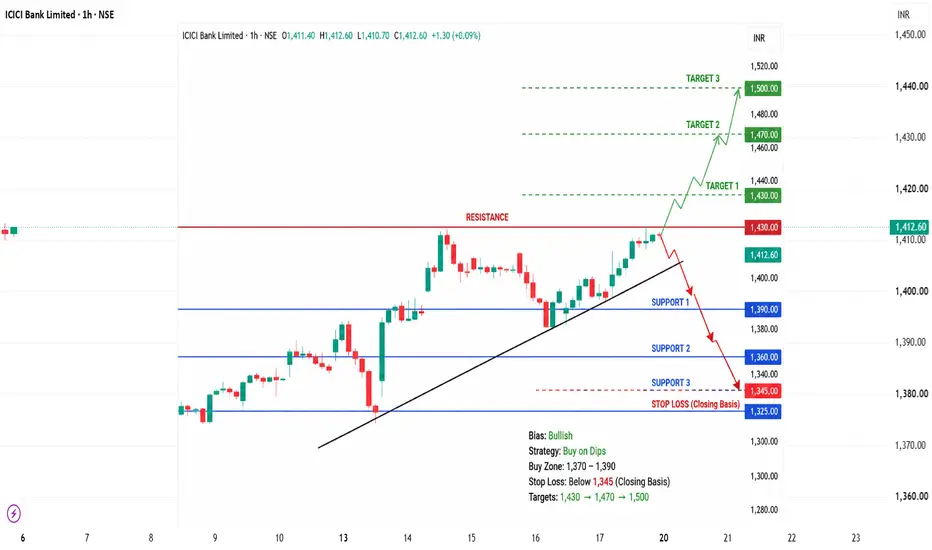
ICICI Bank is trading above its key moving averages and continues to show positive momentum. Recent technical indicators (RSI, MACD, ADX) remain constructive, suggesting the primary trend is still up.
📈 Key Resistance Levels
₹1,420–1,430 – Immediate resistance zone
₹1,450–1,470 – Strong supply zone
₹1,495–1,500 – Major resistance / 52-week high area
📉 Key Support Levels
₹1,390–1,380 – First support
₹1,360–1,345 – Strong demand zone
₹1,320–1,325 – Major swing support
Trading Scenarios
🟢 Bullish
Holding above ₹1,380–1,390 keeps the uptrend intact.
A decisive breakout above ₹1,430 can open the way toward ₹1,470–1,500.
🔴 Bearish
A close below ₹1,360 could trigger profit booking.
Below ₹1,325, the trend would weaken and a deeper correction becomes possible.
Swing Trading Plan
Buy Zone: ₹1,370–1,390
Stop Loss: Below ₹1,345 (closing basis)
Targets: ₹1,430 → ₹1,470 → ₹1,500
Overall View: ICICI Bank remains one of the stronger banking stocks. As long as it stays above the ₹1,360 support zone, the trend favors buying on dips rather than selling rallies.
📈 Key Resistance Levels
₹1,420–1,430 – Immediate resistance zone
₹1,450–1,470 – Strong supply zone
₹1,495–1,500 – Major resistance / 52-week high area
📉 Key Support Levels
₹1,390–1,380 – First support
₹1,360–1,345 – Strong demand zone
₹1,320–1,325 – Major swing support
Trading Scenarios
🟢 Bullish
Holding above ₹1,380–1,390 keeps the uptrend intact.
A decisive breakout above ₹1,430 can open the way toward ₹1,470–1,500.
🔴 Bearish
A close below ₹1,360 could trigger profit booking.
Below ₹1,325, the trend would weaken and a deeper correction becomes possible.
Swing Trading Plan
Buy Zone: ₹1,370–1,390
Stop Loss: Below ₹1,345 (closing basis)
Targets: ₹1,430 → ₹1,470 → ₹1,500
Overall View: ICICI Bank remains one of the stronger banking stocks. As long as it stays above the ₹1,360 support zone, the trend favors buying on dips rather than selling rallies.

Похожие публикации
Отказ от ответственности
Информация и публикации не предназначены для предоставления и не являются финансовыми, инвестиционными, торговыми или другими видами советов или рекомендаций, предоставленных или одобренных TradingView. Подробнее читайте в Условиях использования.
Похожие публикации
Отказ от ответственности
Информация и публикации не предназначены для предоставления и не являются финансовыми, инвестиционными, торговыми или другими видами советов или рекомендаций, предоставленных или одобренных TradingView. Подробнее читайте в Условиях использования.