
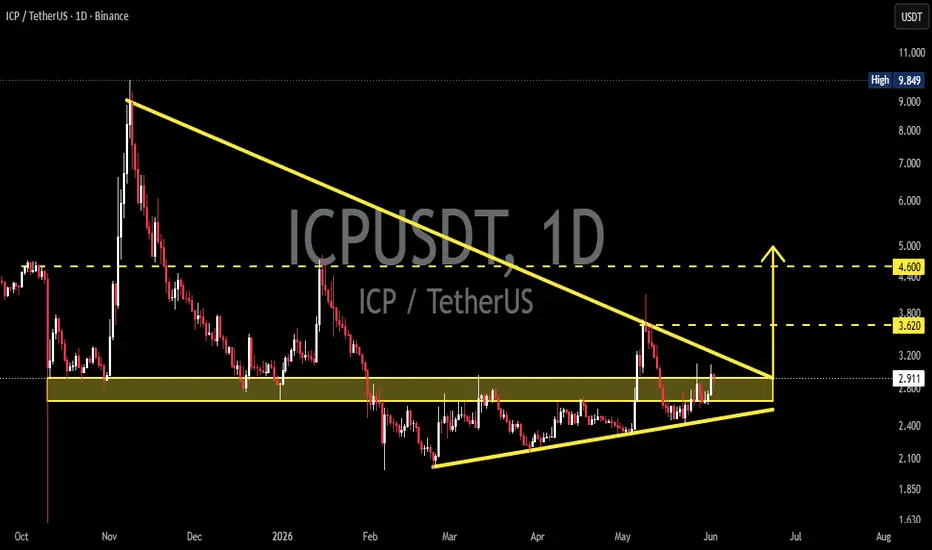
The ICPUSDT chart is currently showing a very interesting structure after experiencing a prolonged downtrend since its November 2025 peak. Price is now moving within an Ascending Support and Descending Resistance structure, creating a compression zone as it approaches the apex point. 📐
In addition, there is a strong demand zone (yellow block) between 2.60 – 2.90 USDT 🟨, which has repeatedly acted as a key support area over the past several months. Every time price enters this zone, buying pressure reappears and prevents deeper declines.
At the moment, price is testing a long-term descending resistance trendline that has capped price action for months. The closer price gets to the intersection of these two trendlines, the greater the probability of an explosive move. ⚡
---
🔍 Pattern Formation
📐 1. Descending Resistance Trendline
The descending trendline that started from the peak around $9.80 remains the primary resistance.
Pattern Characteristics:
✅ Lower Highs have continued to form since November 2025.
✅ Indicates that long-term selling pressure is still present.
✅ A valid breakout would require price to break and close above this trendline.
---
📈 2. Ascending Support Trendline
On the lower side, support has been steadily rising since February 2026.
Characteristics:
✅ Higher Lows continue to form.
✅ Suggests buyers are gradually accumulating positions.
✅ Indicates an ongoing accumulation phase.
---
🔺 3. Large Symmetrical Triangle
The combination of both trendlines creates a Symmetrical Triangle pattern.
Pattern Characteristics:
🔹 Volatility continues to decrease.
🔹 Price is moving toward the apex.
🔹 Typically followed by a significant breakout after an extended consolidation phase.
🔹 Volume often declines during the formation and expands during the breakout.
🔹 The longer the pattern develops, the larger the potential move after the breakout.
---
🟢 Bullish Scenario
A bullish confirmation would occur if price:
✅ Holds above the 2.60 – 2.90 USDT demand zone.
✅ Breaks above the descending resistance trendline.
✅ Achieves a daily close above the 3.20 – 3.30 USDT area.
🎯 Bullish Targets
🥇 Target 1: 3.62 USDT
A nearby horizontal resistance level that previously acted as a rejection area.
🥈 Target 2: 4.60 USDT
The next major resistance level and the primary breakout target of the triangle pattern.
🥉 Target 3 (Aggressive): 5.00+ USDT
If bullish momentum strengthens significantly, price could continue its recovery toward the psychological $5.00 area and beyond.
📈 Bullish Supporting Factors
✔️ Strong demand zone remains intact.
✔️ Higher Lows continue to develop.
✔️ Selling pressure appears to be weakening.
✔️ Compression structures often precede large price movements.
✔️ Risk-to-reward is becoming increasingly attractive for medium-term buyers.
---
🔴 Bearish Scenario
A bearish scenario becomes active if:
❌ Price fails to break the resistance trendline.
❌ Strong rejection occurs near the upper trendline.
❌ The 2.60 – 2.90 USDT demand zone is broken with a daily close below the area.
🎯 Bearish Targets
🔻 Target 1: 2.40 USDT
The nearest minor support level.
🔻 Target 2: 2.10 USDT
A historical support area that previously generated strong rebounds.
🔻 Target 3: 1.85 USDT
A major support zone if a full breakdown from the triangle structure occurs.
⚠️ Bearish Risk Factors
⚠️ False breakout (fakeout) above the trendline.
⚠️ Weak breakout volume.
⚠️ A sharp Bitcoin correction that could pressure the broader altcoin market.
⚠️ Failure to defend the primary demand zone.
---
🎯 Conclusion
ICPUSDT is currently entering one of its most important phases in recent months. The 2.60 – 2.90 USDT demand zone 🟨 serves as the main defense area for buyers and the foundation of the developing bullish structure.
As long as price remains above this demand zone, the potential for a breakout toward 3.62 USDT and 4.60 USDT remains highly favorable. 🚀
However, if this demand zone is lost, bearish momentum could drive price back toward lower support levels. 📉
📌 Traders should closely monitor price action around the descending resistance trendline and breakout volume for confirmation of the next major move.
#ICPUSDT #ICP #InternetComputer #Crypto #Cryptocurrency #Altcoin #Binance #TechnicalAnalysis #TradingView #ChartAnalysis #Bullish #Bearish #SymmetricalTriangle #Breakout #Accumulation #SupportAndResistance #PriceAction #CryptoTrading #Altseason #USDT
In addition, there is a strong demand zone (yellow block) between 2.60 – 2.90 USDT 🟨, which has repeatedly acted as a key support area over the past several months. Every time price enters this zone, buying pressure reappears and prevents deeper declines.
At the moment, price is testing a long-term descending resistance trendline that has capped price action for months. The closer price gets to the intersection of these two trendlines, the greater the probability of an explosive move. ⚡
---
🔍 Pattern Formation
📐 1. Descending Resistance Trendline
The descending trendline that started from the peak around $9.80 remains the primary resistance.
Pattern Characteristics:
✅ Lower Highs have continued to form since November 2025.
✅ Indicates that long-term selling pressure is still present.
✅ A valid breakout would require price to break and close above this trendline.
---
📈 2. Ascending Support Trendline
On the lower side, support has been steadily rising since February 2026.
Characteristics:
✅ Higher Lows continue to form.
✅ Suggests buyers are gradually accumulating positions.
✅ Indicates an ongoing accumulation phase.
---
🔺 3. Large Symmetrical Triangle
The combination of both trendlines creates a Symmetrical Triangle pattern.
Pattern Characteristics:
🔹 Volatility continues to decrease.
🔹 Price is moving toward the apex.
🔹 Typically followed by a significant breakout after an extended consolidation phase.
🔹 Volume often declines during the formation and expands during the breakout.
🔹 The longer the pattern develops, the larger the potential move after the breakout.
---
🟢 Bullish Scenario
A bullish confirmation would occur if price:
✅ Holds above the 2.60 – 2.90 USDT demand zone.
✅ Breaks above the descending resistance trendline.
✅ Achieves a daily close above the 3.20 – 3.30 USDT area.
🎯 Bullish Targets
🥇 Target 1: 3.62 USDT
A nearby horizontal resistance level that previously acted as a rejection area.
🥈 Target 2: 4.60 USDT
The next major resistance level and the primary breakout target of the triangle pattern.
🥉 Target 3 (Aggressive): 5.00+ USDT
If bullish momentum strengthens significantly, price could continue its recovery toward the psychological $5.00 area and beyond.
📈 Bullish Supporting Factors
✔️ Strong demand zone remains intact.
✔️ Higher Lows continue to develop.
✔️ Selling pressure appears to be weakening.
✔️ Compression structures often precede large price movements.
✔️ Risk-to-reward is becoming increasingly attractive for medium-term buyers.
---
🔴 Bearish Scenario
A bearish scenario becomes active if:
❌ Price fails to break the resistance trendline.
❌ Strong rejection occurs near the upper trendline.
❌ The 2.60 – 2.90 USDT demand zone is broken with a daily close below the area.
🎯 Bearish Targets
🔻 Target 1: 2.40 USDT
The nearest minor support level.
🔻 Target 2: 2.10 USDT
A historical support area that previously generated strong rebounds.
🔻 Target 3: 1.85 USDT
A major support zone if a full breakdown from the triangle structure occurs.
⚠️ Bearish Risk Factors
⚠️ False breakout (fakeout) above the trendline.
⚠️ Weak breakout volume.
⚠️ A sharp Bitcoin correction that could pressure the broader altcoin market.
⚠️ Failure to defend the primary demand zone.
---
🎯 Conclusion
ICPUSDT is currently entering one of its most important phases in recent months. The 2.60 – 2.90 USDT demand zone 🟨 serves as the main defense area for buyers and the foundation of the developing bullish structure.
As long as price remains above this demand zone, the potential for a breakout toward 3.62 USDT and 4.60 USDT remains highly favorable. 🚀
However, if this demand zone is lost, bearish momentum could drive price back toward lower support levels. 📉
📌 Traders should closely monitor price action around the descending resistance trendline and breakout volume for confirmation of the next major move.
#ICPUSDT #ICP #InternetComputer #Crypto #Cryptocurrency #Altcoin #Binance #TechnicalAnalysis #TradingView #ChartAnalysis #Bullish #Bearish #SymmetricalTriangle #Breakout #Accumulation #SupportAndResistance #PriceAction #CryptoTrading #Altseason #USDT

✅ Get Free Signals! Join Our Telegram Channel Here: t.me/TheCryptoNuclear
✅ Twitter: twitter.com/crypto_nuclear
✅ Join Bybit : partner.bybit.com/b/nuclearvip
✅ Benefits : Lifetime Trading Fee Discount -50%
✅ Twitter: twitter.com/crypto_nuclear
✅ Join Bybit : partner.bybit.com/b/nuclearvip
✅ Benefits : Lifetime Trading Fee Discount -50%
Отказ от ответственности
Информация и публикации не предназначены для предоставления и не являются финансовыми, инвестиционными, торговыми или другими видами советов или рекомендаций, предоставленных или одобренных TradingView. Подробнее читайте в Условиях использования.
✅ Get Free Signals! Join Our Telegram Channel Here: t.me/TheCryptoNuclear
✅ Twitter: twitter.com/crypto_nuclear
✅ Join Bybit : partner.bybit.com/b/nuclearvip
✅ Benefits : Lifetime Trading Fee Discount -50%
✅ Twitter: twitter.com/crypto_nuclear
✅ Join Bybit : partner.bybit.com/b/nuclearvip
✅ Benefits : Lifetime Trading Fee Discount -50%
Отказ от ответственности
Информация и публикации не предназначены для предоставления и не являются финансовыми, инвестиционными, торговыми или другими видами советов или рекомендаций, предоставленных или одобренных TradingView. Подробнее читайте в Условиях использования.