Обновлено
ICX: Triangle Pop?
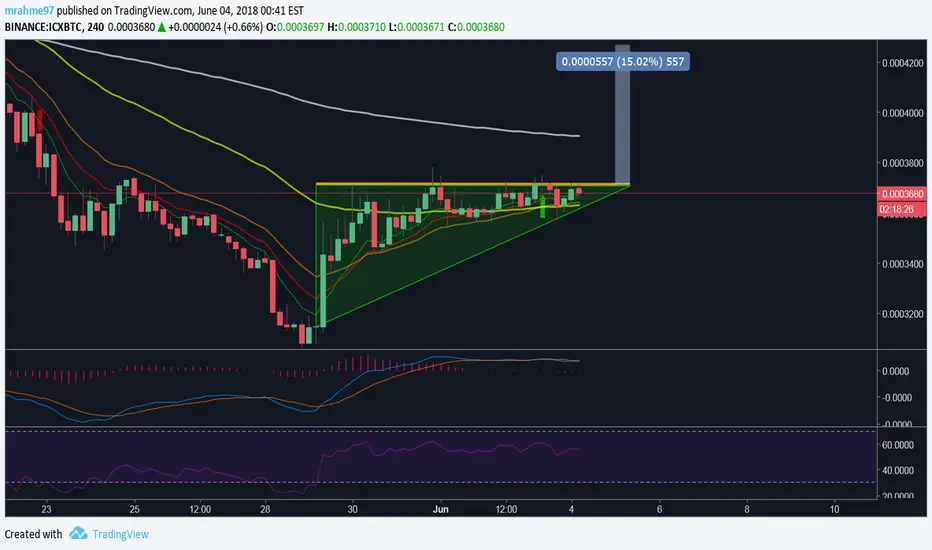
I haven't seen a chart like this in a while. The indicators are aggressively neutral, but I have identified an ascending triangle. To add to this, the 55EMA is below the 21, 13 and 8 lines, which is another short-term bullish sign.
This isn't the safest play, and I have a feeling there's some artificial pricing happening here, but if I'm right, then we'll gain some good insight into how market makers can even toy with indicators when they want to.
This isn't the safest play, and I have a feeling there's some artificial pricing happening here, but if I'm right, then we'll gain some good insight into how market makers can even toy with indicators when they want to.
Заметка
Looks like it broke down. In retrospect, I should have looked at volume to determine the pattern direction. It was quite low here, which makes sense with respect to the downside movement. Plus, low volume is great for manipulation.
It would have been an ever better play for the whale if they had faked an upside breakout first.. but they could even be pulling a fake right now. Either way, remember to always buy on support confirmation (or indicators if it's super quick action) and to set a stop loss.
Заявка отменена
Trade cancelled based on previous comment.
Отказ от ответственности
Информация и публикации не предназначены для предоставления и не являются финансовыми, инвестиционными, торговыми или другими видами советов или рекомендаций, предоставленных или одобренных TradingView. Подробнее читайте в Условиях использования.
Отказ от ответственности
Информация и публикации не предназначены для предоставления и не являются финансовыми, инвестиционными, торговыми или другими видами советов или рекомендаций, предоставленных или одобренных TradingView. Подробнее читайте в Условиях использования.