
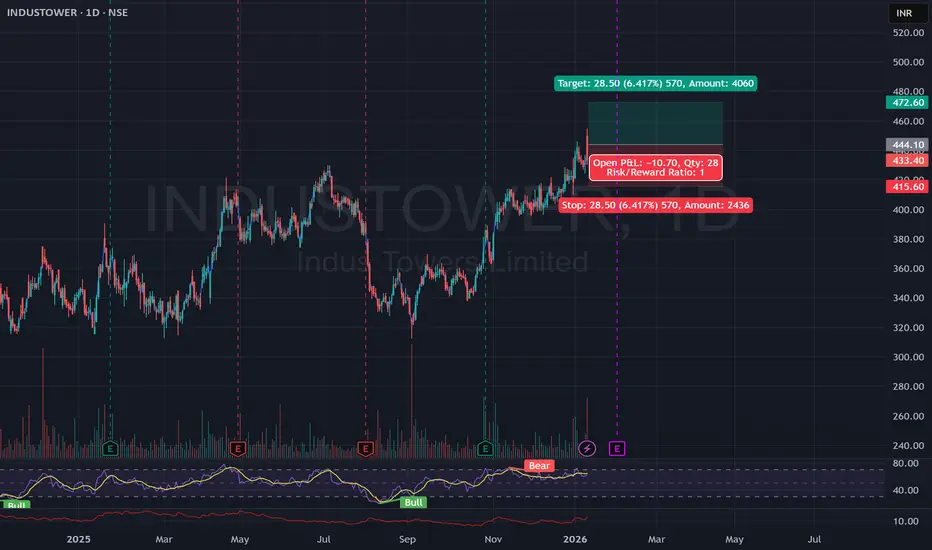
The chart for Indus Towers (INDUSTOWER) shows a strong bullish setup. Here are the technical reasons why it is currently positioned to move higher:
Bullish Breakout: The price has recently broken above a significant resistance zone near 420–430. This "breakout" suggests that buyers have regained control after a period of consolidation.
Higher Highs & Lows: On the daily (1D) timeframe, the stock is in a clear uptrend. It consistently forms higher lows (support moving up) and higher highs, which is a classic signal of sustained demand.
Support Flip: Previous resistance around 415 is now acting as a "floor" (support). The trade setup in your image uses this level as a safety net (Stop Loss), indicating a high-conviction area where buyers are expected to step in.
Momentum & Volume: The recent price surge is accompanied by healthy volume (shown at the bottom), confirming that the move up is backed by institutional or large-scale buying rather than random fluctuation.
Target Level: The chart identifies a clear technical target at 472.60, which aligns with the next major historical resistance level.
Summary: The stock has transitioned from a sideways range into a confirmed uptrend by breaking key resistance with momentum.
Bullish Breakout: The price has recently broken above a significant resistance zone near 420–430. This "breakout" suggests that buyers have regained control after a period of consolidation.
Higher Highs & Lows: On the daily (1D) timeframe, the stock is in a clear uptrend. It consistently forms higher lows (support moving up) and higher highs, which is a classic signal of sustained demand.
Support Flip: Previous resistance around 415 is now acting as a "floor" (support). The trade setup in your image uses this level as a safety net (Stop Loss), indicating a high-conviction area where buyers are expected to step in.
Momentum & Volume: The recent price surge is accompanied by healthy volume (shown at the bottom), confirming that the move up is backed by institutional or large-scale buying rather than random fluctuation.
Target Level: The chart identifies a clear technical target at 472.60, which aligns with the next major historical resistance level.
Summary: The stock has transitioned from a sideways range into a confirmed uptrend by breaking key resistance with momentum.

Отказ от ответственности
Информация и публикации не предназначены для предоставления и не являются финансовыми, инвестиционными, торговыми или другими видами советов или рекомендаций, предоставленных или одобренных TradingView. Подробнее читайте в Условиях использования.
Отказ от ответственности
Информация и публикации не предназначены для предоставления и не являются финансовыми, инвестиционными, торговыми или другими видами советов или рекомендаций, предоставленных или одобренных TradingView. Подробнее читайте в Условиях использования.