Длинная
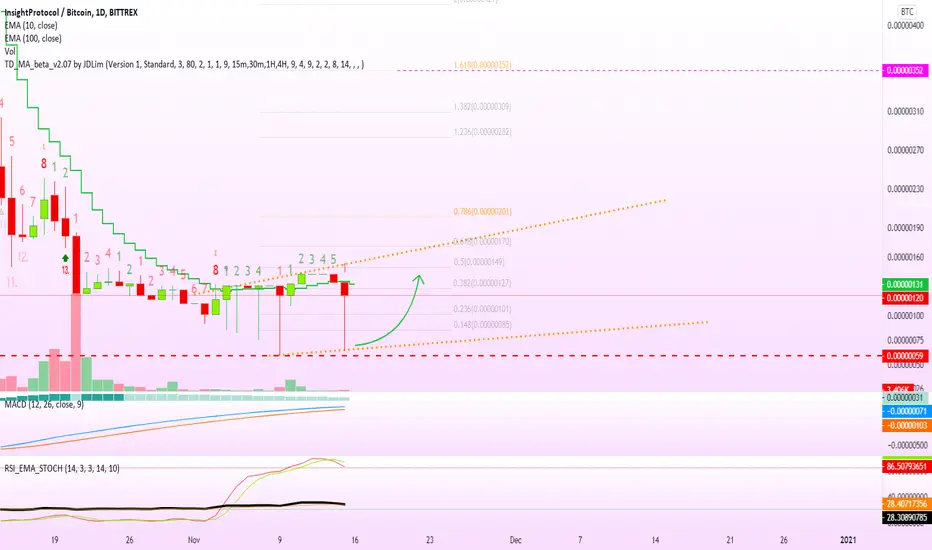
InsightProtocol (INX) Full Recover | Will Grow!
Remember the chart for DCRBTC?
I'll share in the related ideas below...
Here we have something similar, we have a very long lower wick/shadow on the latest candle which can signal that the bears fought to push prices down but the bulls entered back with force.

This signal is only confirmed once the candle close.
Looking at the daily timeframe, the main chart above... We can see a lower high and the bearish volume being very low.
If prices manage to close above 0.00000131 today or EMA10, we will this INXBTC jump strong and print huge gains.
This is Alan Masters.
Namaste.
I'll share in the related ideas below...
Here we have something similar, we have a very long lower wick/shadow on the latest candle which can signal that the bears fought to push prices down but the bulls entered back with force.
This signal is only confirmed once the candle close.
Looking at the daily timeframe, the main chart above... We can see a lower high and the bearish volume being very low.
If prices manage to close above 0.00000131 today or EMA10, we will this INXBTC jump strong and print huge gains.
This is Alan Masters.
Namaste.

✅ Cryptocurrencies technical analysis & results
t.me/masteranandatrades/9279
✅ Stocks technical analysis
t.me/anandastocks
✅ Enjoyed the content? Join my PREMIUM channels for more... t.me/lamatrades/4 (since 2017)
t.me/masteranandatrades/9279
✅ Stocks technical analysis
t.me/anandastocks
✅ Enjoyed the content? Join my PREMIUM channels for more... t.me/lamatrades/4 (since 2017)
Похожие публикации
Отказ от ответственности
Информация и публикации не предназначены для предоставления и не являются финансовыми, инвестиционными, торговыми или другими видами советов или рекомендаций, предоставленных или одобренных TradingView. Подробнее читайте в Условиях использования.
✅ Cryptocurrencies technical analysis & results
t.me/masteranandatrades/9279
✅ Stocks technical analysis
t.me/anandastocks
✅ Enjoyed the content? Join my PREMIUM channels for more... t.me/lamatrades/4 (since 2017)
t.me/masteranandatrades/9279
✅ Stocks technical analysis
t.me/anandastocks
✅ Enjoyed the content? Join my PREMIUM channels for more... t.me/lamatrades/4 (since 2017)
Похожие публикации
Отказ от ответственности
Информация и публикации не предназначены для предоставления и не являются финансовыми, инвестиционными, торговыми или другими видами советов или рекомендаций, предоставленных или одобренных TradingView. Подробнее читайте в Условиях использования.