Длинная
25.12.29 IPUSDT.P Analysis
This is ACID TRADE.
Today is December 29, 2025, and we will be analyzing a cryptocurrency chart.
Reference chart (Upbit):

This is a coin I encountered for the first time through Upbit.
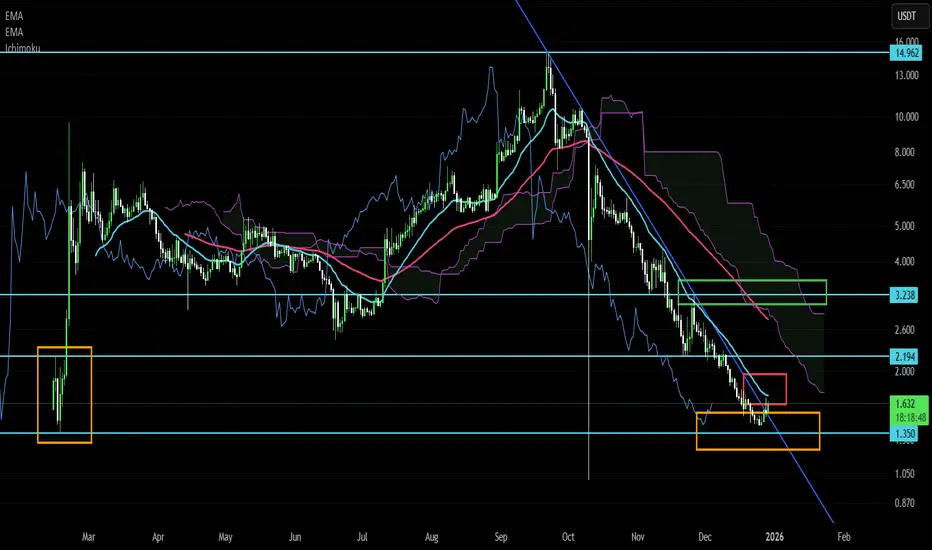
Looking at the daily chart, the long-term resistance trendline has been broken to the upside, and price is attempting to recover with a mild bullish candle structure.
The downtrend began around September 2025 and continued for approximately four months.
After this extended decline, the current movement suggests a potential trend reversal.
From the perspective of Upbit’s spot chart, this resistance breakout appears to be a meaningful entry signal.
Reference chart (Binance Futures):

This is the same asset viewed on the Binance futures chart.
The resistance trendline breakout is also confirmed on the futures chart, and notably, the breakout occurred earlier on December 28 rather than today.
However, price has not yet reclaimed the 20-period moving average.
Whether price can break above and stabilize above the 20 MA will be an important factor moving forward.
Spot Trading Strategy (Current View):

This is the current spot trading strategy.
Please focus on the orange box zone on the chart.
Looking back to the time of the initial listing, the historical low was around 1.35.
On the daily chart, price previously formed a range between approximately 1.35 and 2.194.
During the recent decline, price did not break below the prior low and instead broke above the resistance trendline.
Based on this structure, the bullish bias remains strong following the breakout.
From the current perspective, the resistance breakout supports a long bias.
The first retracement target is around 2.194.
For the next target, I am looking toward 3.2.
This level aligns with the expansion of the daily 60-period moving average and the lower boundary of the Ichimoku cloud resistance.
Given the available supply structure, it is reasonable to keep the possibility of a move toward 3.2 open when managing trades.
Conclusion
The long-term resistance trendline has been broken after a four-month downtrend.
Price held the prior low and confirmed a bullish breakout structure.
The bullish bias remains valid while support holds.
The first target is 2.194, with an extended target toward 3.2.
Today is December 29, 2025, and we will be analyzing a cryptocurrency chart.
Reference chart (Upbit):
This is a coin I encountered for the first time through Upbit.
Looking at the daily chart, the long-term resistance trendline has been broken to the upside, and price is attempting to recover with a mild bullish candle structure.
The downtrend began around September 2025 and continued for approximately four months.
After this extended decline, the current movement suggests a potential trend reversal.
From the perspective of Upbit’s spot chart, this resistance breakout appears to be a meaningful entry signal.
Reference chart (Binance Futures):
This is the same asset viewed on the Binance futures chart.
The resistance trendline breakout is also confirmed on the futures chart, and notably, the breakout occurred earlier on December 28 rather than today.
However, price has not yet reclaimed the 20-period moving average.
Whether price can break above and stabilize above the 20 MA will be an important factor moving forward.
Spot Trading Strategy (Current View):
This is the current spot trading strategy.
Please focus on the orange box zone on the chart.
Looking back to the time of the initial listing, the historical low was around 1.35.
On the daily chart, price previously formed a range between approximately 1.35 and 2.194.
During the recent decline, price did not break below the prior low and instead broke above the resistance trendline.
Based on this structure, the bullish bias remains strong following the breakout.
From the current perspective, the resistance breakout supports a long bias.
The first retracement target is around 2.194.
For the next target, I am looking toward 3.2.
This level aligns with the expansion of the daily 60-period moving average and the lower boundary of the Ichimoku cloud resistance.
Given the available supply structure, it is reasonable to keep the possibility of a move toward 3.2 open when managing trades.
Conclusion
The long-term resistance trendline has been broken after a four-month downtrend.
Price held the prior low and confirmed a bullish breakout structure.
The bullish bias remains valid while support holds.
The first target is 2.194, with an extended target toward 3.2.

Отказ от ответственности
Информация и публикации не предназначены для предоставления и не являются финансовыми, инвестиционными, торговыми или другими видами советов или рекомендаций, предоставленных или одобренных TradingView. Подробнее читайте в Условиях использования.
Отказ от ответственности
Информация и публикации не предназначены для предоставления и не являются финансовыми, инвестиционными, торговыми или другими видами советов или рекомендаций, предоставленных или одобренных TradingView. Подробнее читайте в Условиях использования.